|
|
|
|
|
|
| Monitoring Tools | |
|
|
|
|
|
|
|
| |
|
|
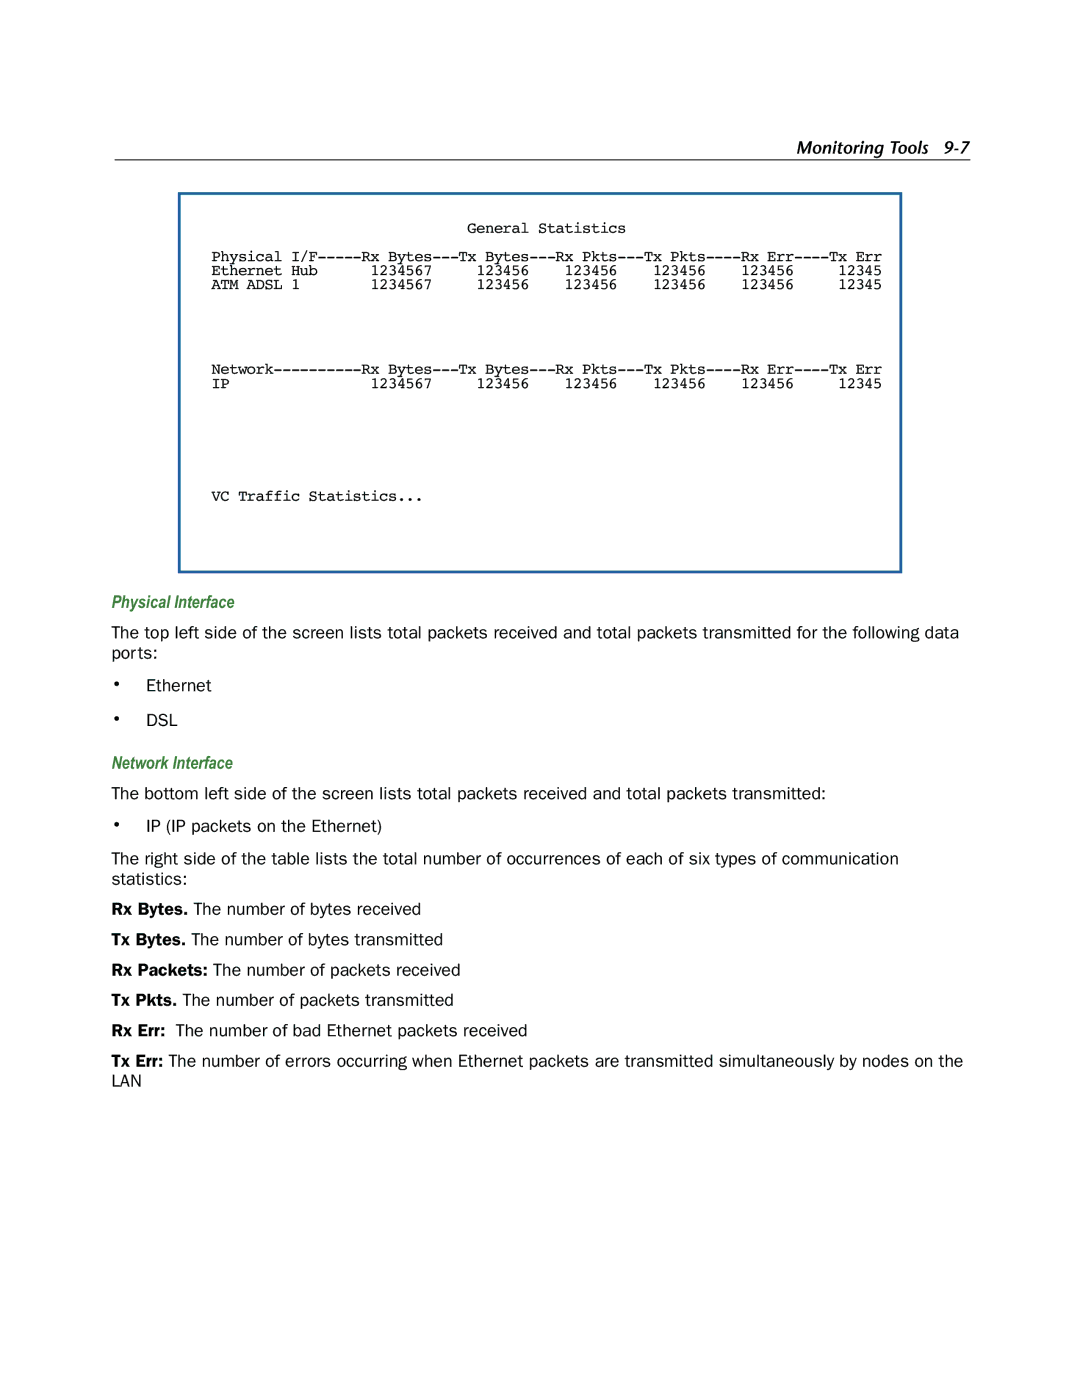
| General Statistics |
|
|
|
| |
| Physical | Rx | Tx | Rx | Tx | Rx | Tx Err |
|
| Ethernet Hub | 1234567 | 123456 | 123456 | 123456 | 123456 | 12345 |
|
| ATM ADSL 1 | 1234567 | 123456 | 123456 | 123456 | 123456 | 12345 |
|
| Rx | Tx | Rx | Tx | Rx | Tx Err |
| |
| IP | 1234567 | 123456 | 123456 | 123456 | 123456 | 12345 |
|
| VC Traffic Statistics... |
|
|
|
|
|
| |
|
|
|
|
|
|
|
|
|
Physical Interface
The top left side of the screen lists total packets received and total packets transmitted for the following data ports:
•Ethernet
•DSL
Network Interface
The bottom left side of the screen lists total packets received and total packets transmitted:
•IP (IP packets on the Ethernet)
The right side of the table lists the total number of occurrences of each of six types of communication statistics:
Rx Bytes. The number of bytes received
Tx Bytes. The number of bytes transmitted
Rx Packets: The number of packets received
Tx Pkts. The number of packets transmitted
Rx Err: The number of bad Ethernet packets received
Tx Err: The number of errors occurring when Ethernet packets are transmitted simultaneously by nodes on the
LAN