Note | Plot Calibration Data enabled provides the blue |
| lines to show linearity before calibration and |
| black lines to show linearity after calibration |
| when you finished the advanced calibration. |
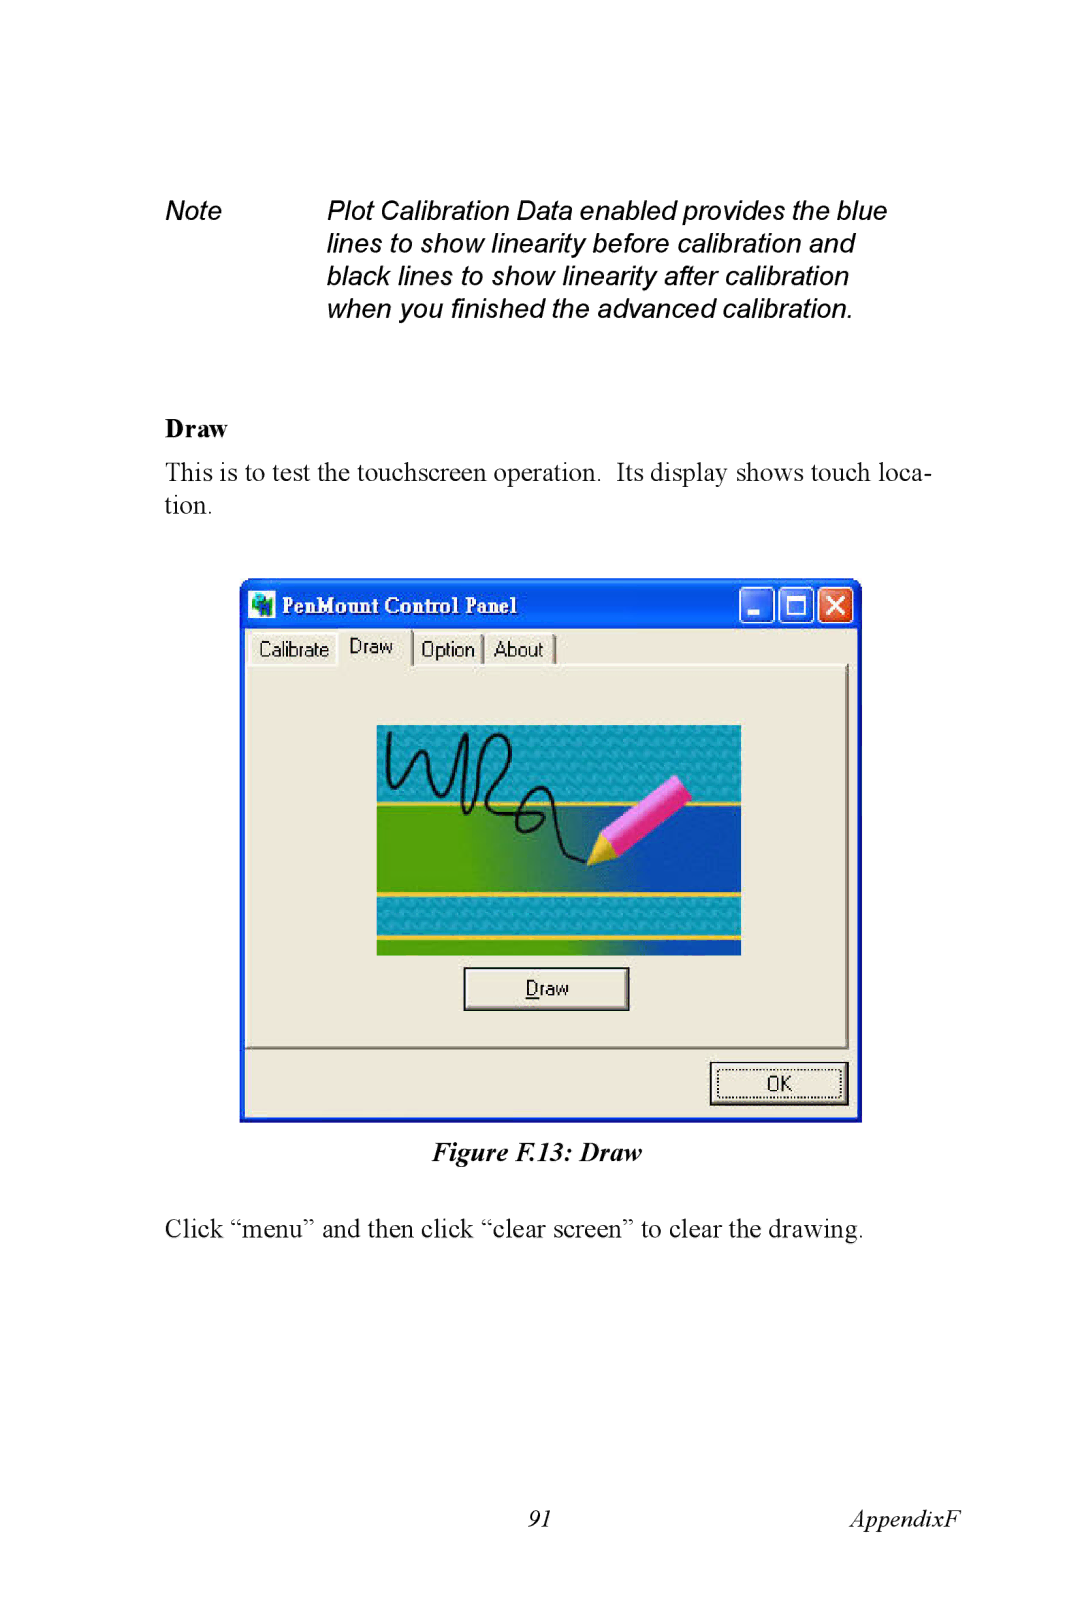
Draw
This is to test the touchscreen operation. Its display shows touch loca- tion.
Figure F.13: Draw
Click “menu” and then click “clear screen” to clear the drawing.
91 | AppendixF |