![]()
![]()
![]()
![]()
![]()
![]()
![]()
![]()
![]()
![]()
![]()
![]()
![]()
![]()

![]()
![]()
![]()
![]()
![]()
![]()
![]()
![]()
![]()
![]()
![]()
![]()
![]()
![]()
![]()
![]()
![]()
![]()
![]()
![]()
![]()
![]()
![]() TABLE
TABLE ![]()
![]()
![]()
![]()
![]()
![]()
![]()
![]()
![]()
![]()
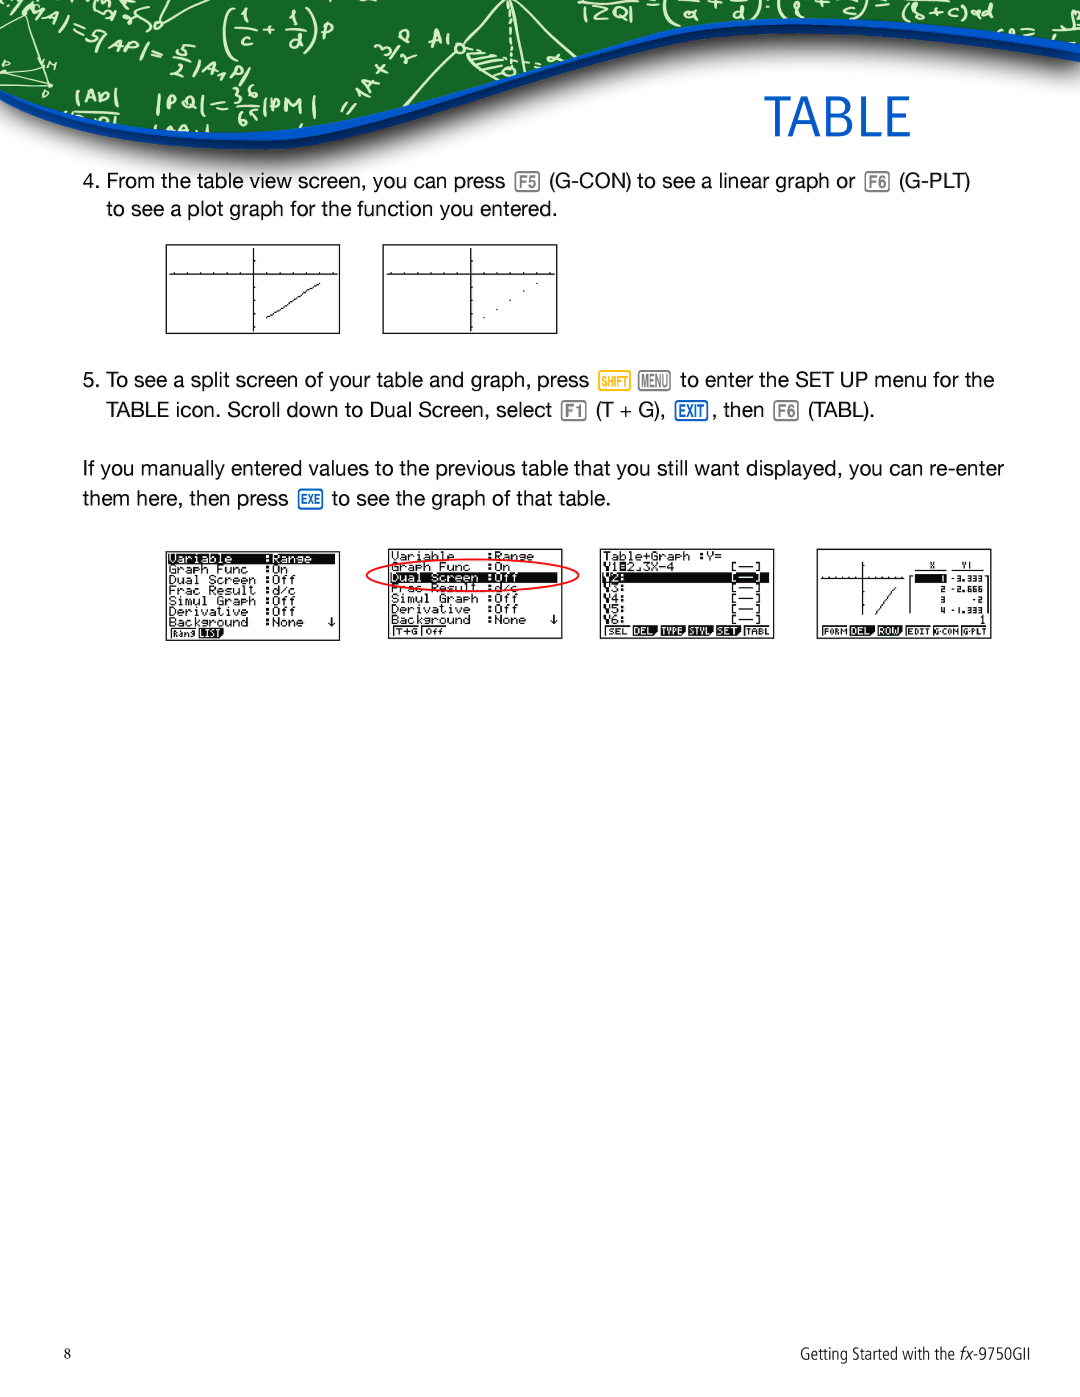
4.From the table view screen, you can press Y
5.To see a split screen of your table and graph, press LP to enter the SET UP menu for the TABLE icon. Scroll down to Dual Screen, select Q (T + G), D, then U (TABL).
If you manually entered values to the previous table that you still want displayed, you can
8 | Getting Started with the |