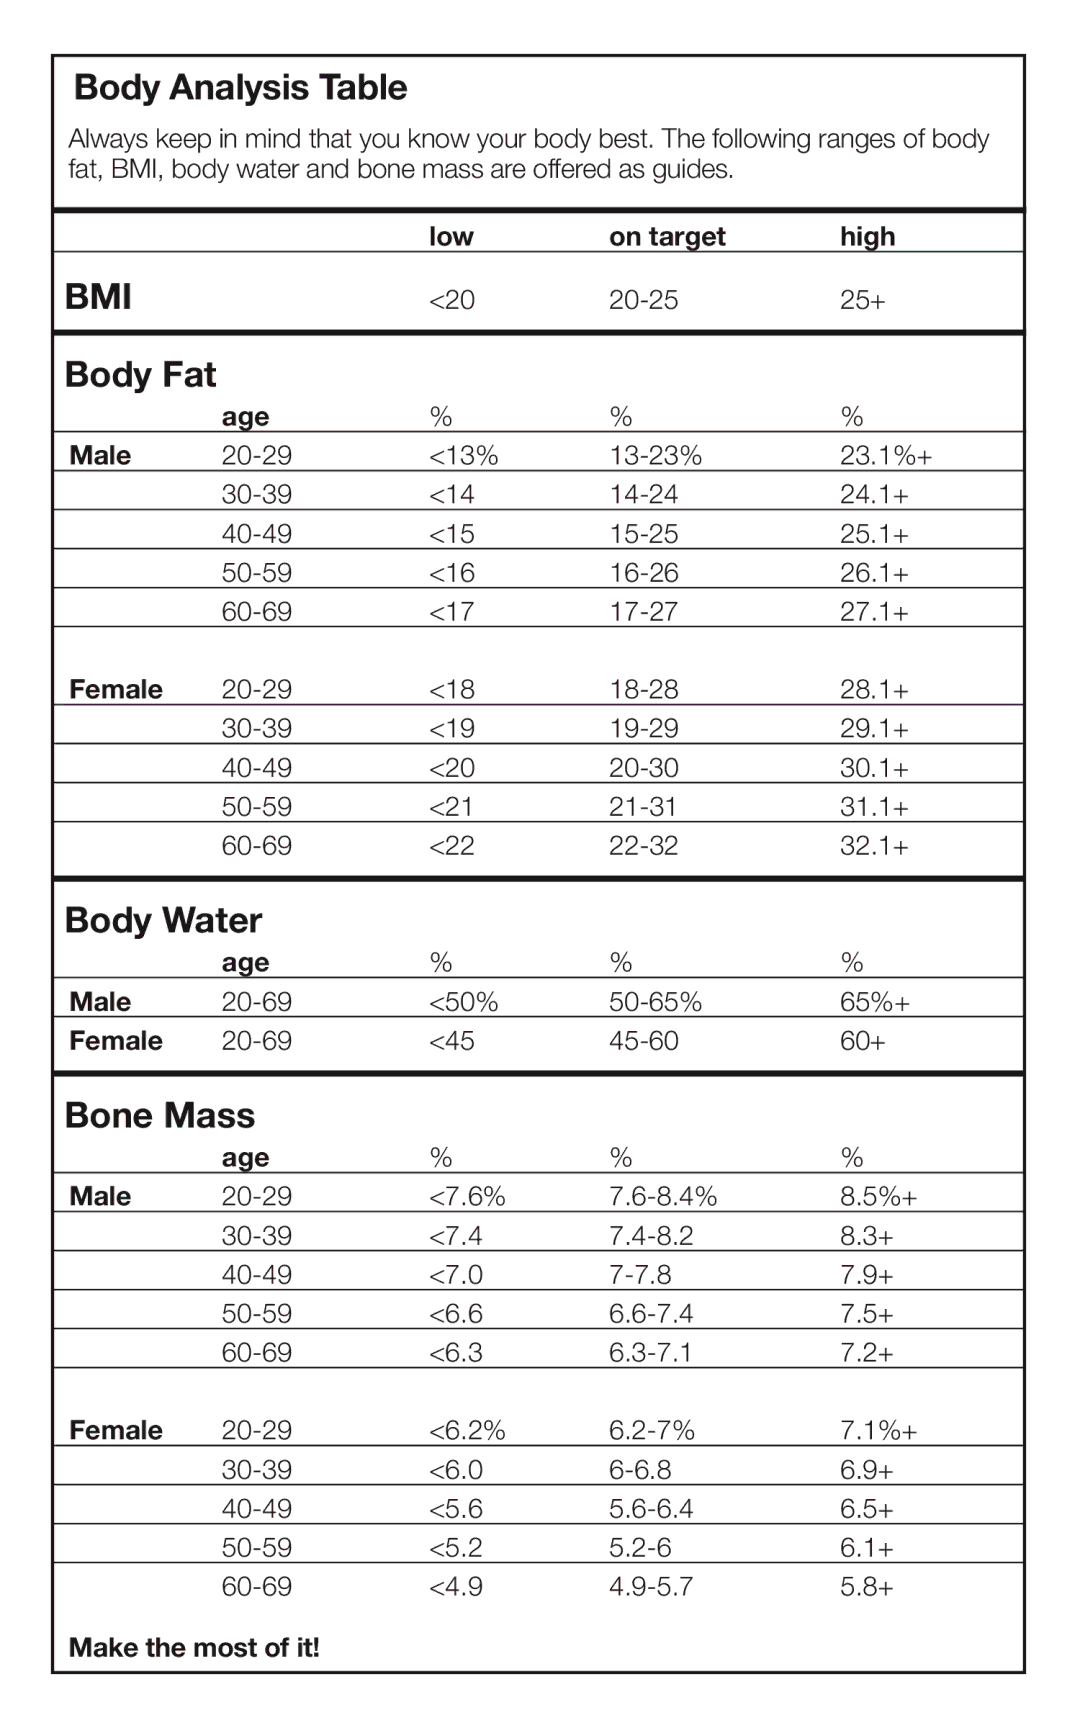
Body Analysis Table
Always keep in mind that you know your body best. The following ranges of body fat, BMI, body water and bone mass are offered as guides.
BMI
low | on target | high |
<20 | 25+ |
Body Fat
| age | % | % | % |
Male | <13% | 23.1%+ | ||
| <14 | 24.1+ | ||
| <15 | 25.1+ | ||
| <16 | 26.1+ | ||
| <17 | 27.1+ | ||
Female | <18 | 28.1+ | ||
| <19 | 29.1+ | ||
| <20 | 30.1+ | ||
| <21 | 31.1+ | ||
| <22 | 32.1+ | ||
|
|
|
| |
Body Water |
|
|
| |
| age | % | % | % |
Male | <50% | 65%+ | ||
Female | <45 | 60+ | ||
|
|
|
| |
Bone Mass |
|
|
| |
| age | % | % | % |
Male | <7.6% | 8.5%+ | ||
| <7.4 | 8.3+ | ||
| <7.0 | 7.9+ | ||
| <6.6 | 7.5+ | ||
| <6.3 | 7.2+ | ||
Female | <6.2% | 7.1%+ | ||
| <6.0 | 6.9+ | ||
| <5.6 | 6.5+ | ||
| <5.2 | 6.1+ | ||
| <4.9 | 5.8+ | ||
Make the most of it!