
SB528zP specifications
The EAW SB528zP, a prominent offering from Eastern Acoustic Works, is known for its powerful performance and innovative design, making it a preferred choice for professional audio applications. This subwoofer is specifically engineered to deliver deep, impactful bass, catering to the needs of various live sound environments, including concerts, festivals, and theatrical events.One of the main features of the SB528zP is its dual 18-inch woofers, which are optimized to provide exceptional low-frequency response. These high-efficiency drivers are designed to handle significant power, allowing the subwoofer to reproduce deep bass with clarity and punch. The SB528zP boasts a frequency response that extends down to 30 Hz, ensuring that it can reproduce the lowest notes in music and sound effects, creating a truly immersive experience for audiences.
The enclosures of the SB528zP are constructed from high-quality birch plywood, providing durability and strength while minimizing unwanted resonances. The design incorporates a bass-reflex port, which enhances efficiency and increases output levels. Additionally, the enclosure features rugged protective corners and a durable finish, making it ideal for the rigors of touring and live events.
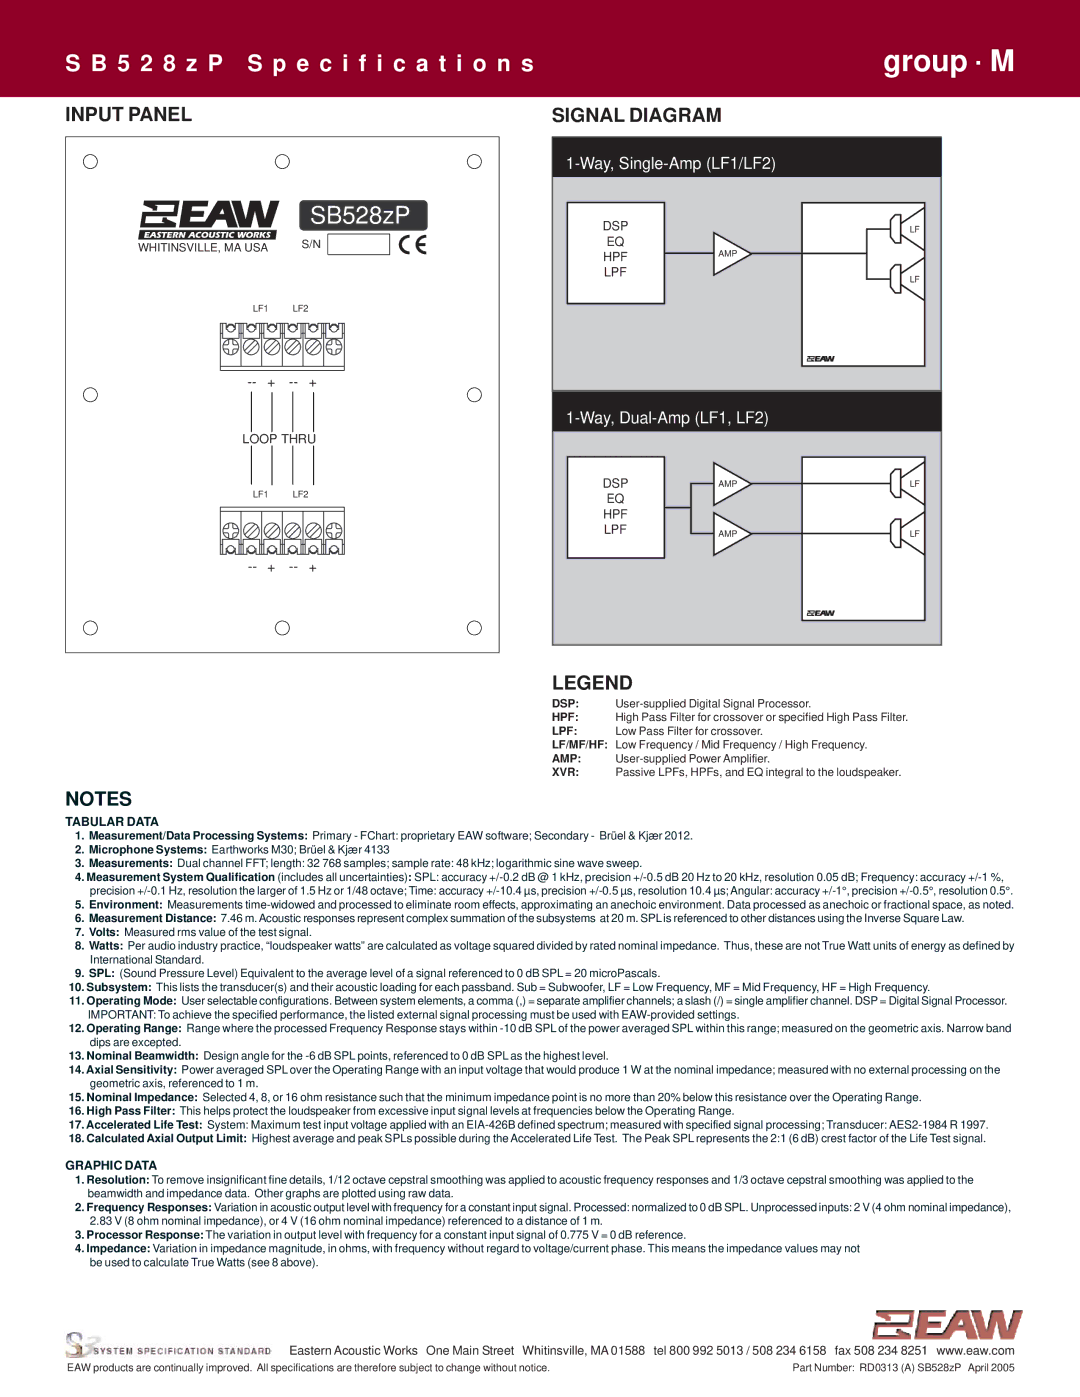
In terms of technologies, the SB528zP incorporates advanced DSP (Digital Signal Processing) capabilities that allow for precise tuning and optimization of audio performance. This DSP technology enables users to easily configure the subwoofer to match the acoustics of different venues, ensuring consistent sound quality regardless of the environment. Furthermore, the subwoofer is compatible with various amplifiers, allowing for flexible setup options.
The SB528zP is also designed with ease of transport and setup in mind. It features integrated handles and a lightweight design, allowing for quick deployment in various settings. The subwoofer can be stacked for convenience, making it an efficient option for mobile applications.
Overall, the EAW SB528zP stands out for its exceptional sound quality, robust construction, and advanced technological features. It is an ideal choice for audio professionals seeking a powerful subwoofer that delivers outstanding performance in a wide range of applications, ensuring that every audience experiences the full impact of live sound. Whether used alone or as part of a larger sound system, the SB528zP excels in delivering an unforgettable sonic experience.