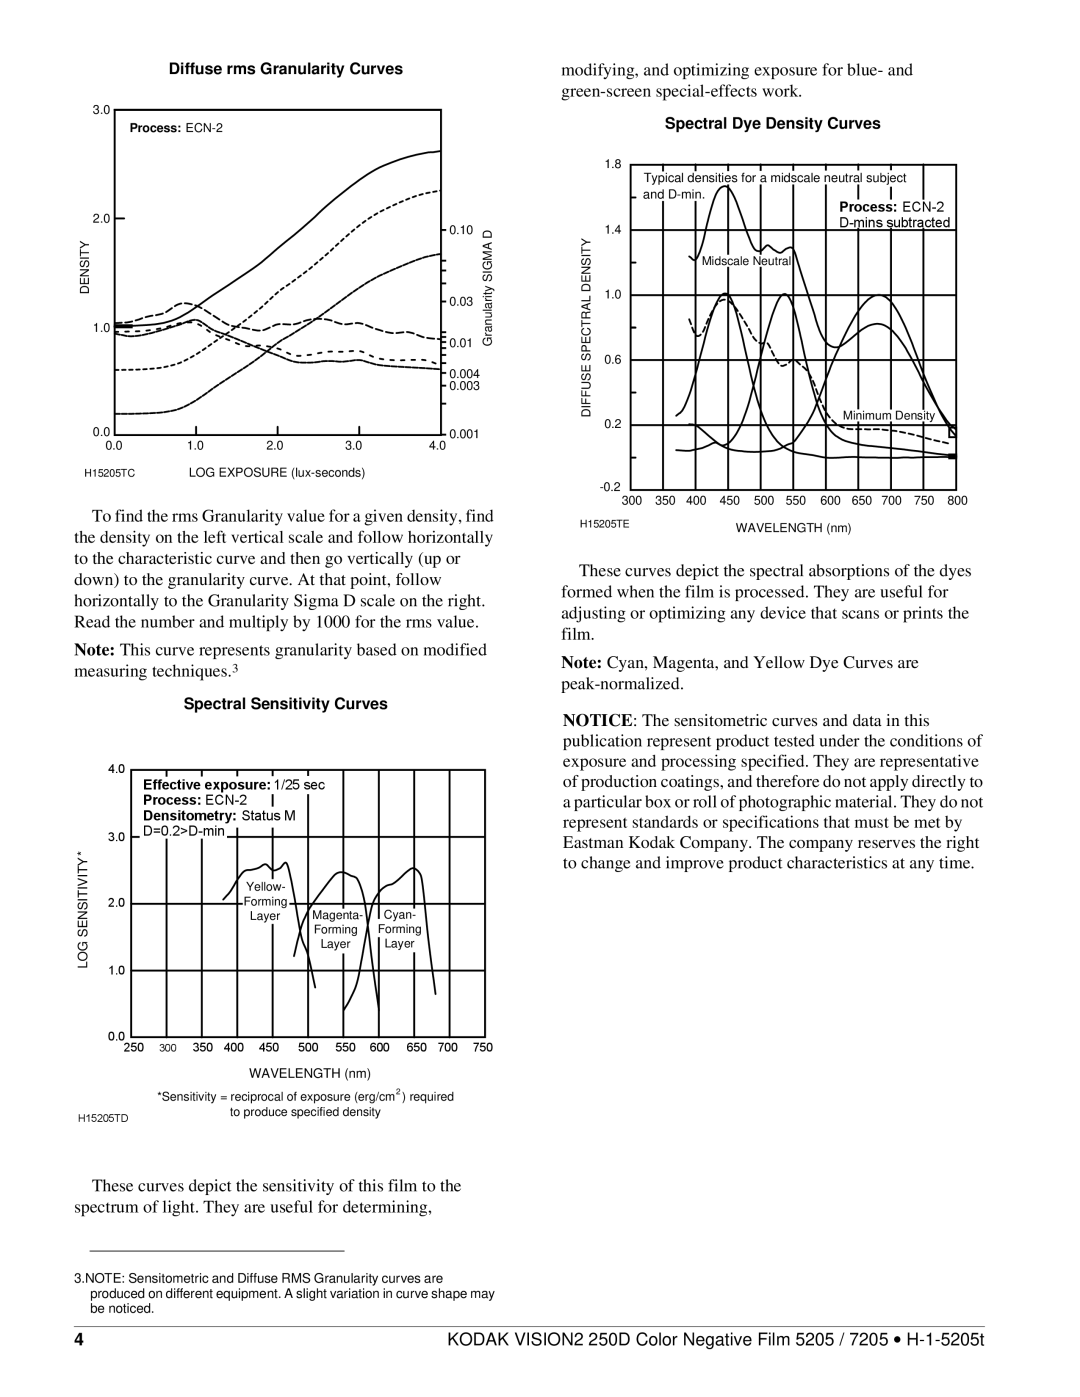
Diffuse rms Granularity Curves
3.0 |
|
|
|
|
|
| Process: |
|
|
|
|
2.0 |
|
|
| 0.10 |
|
|
|
|
| D | |
|
|
|
| 0.03 | Granularity SIGMA |
1.0 |
|
|
|
| |
DENSITY |
|
|
| 0.01 | |
|
|
|
|
| |
|
|
|
| 0.004 |
|
|
|
|
| 0.003 |
|
0.0 |
|
|
| 0.001 |
|
0.0 | 1.0 | 2.0 | 3.0 | 4.0 |
|
H15205TC | LOG EXPOSURE |
To find the rms Granularity value for a given density, find the density on the left vertical scale and follow horizontally to the characteristic curve and then go vertically (up or down) to the granularity curve. At that point, follow horizontally to the Granularity Sigma D scale on the right. Read the number and multiply by 1000 for the rms value.
Note: This curve represents granularity based on modified measuring techniques.3
Spectral Sensitivity Curves
| 4.0 | Effective exposure: 1/25 sec |
|
|
|
| ||||||
|
|
|
|
|
| |||||||
|
| Process: |
|
|
|
|
|
| ||||
|
| Densitometry: Status M |
|
|
|
|
|
| ||||
| 3.0 |
|
|
|
|
|
|
|
| |||
|
|
|
|
|
|
|
|
|
|
|
| |
* |
|
|
|
|
|
|
|
|
|
|
|
|
SENSITIVITY |
|
|
|
|
| Yellow- |
|
|
|
|
|
|
2.0 |
|
|
| Forming | Magenta- | Cyan- |
|
| ||||
|
|
|
|
| Layer |
|
| |||||
|
|
|
|
|
| Forming | Forming |
|
| |||
LOG |
|
|
|
|
|
|
| Layer | Layer |
|
| |
1.0 |
|
|
|
|
|
|
|
|
|
|
| |
|
|
|
|
|
|
|
|
|
|
|
| |
| 0.0250 | 300 | 350 | 400 | 450 | 500 | 550 | 600 | 650 | 700 | 750 | |
WAVELENGTH (nm)
*Sensitivity = reciprocal of exposure (erg/cm2 ) required
H15205TD | to produce specified density |
|
These curves depict the sensitivity of this film to the spectrum of light. They are useful for determining,
3.NOTE: Sensitometric and Diffuse RMS Granularity curves are produced on different equipment. A slight variation in curve shape may be noticed.
modifying, and optimizing exposure for blue- and
Spectral Dye Density Curves
| 1.8 | Typical densities for a midscale neutral subject |
|
| |||||||
|
|
|
| ||||||||
|
| and |
|
|
| Process: |
| ||||
|
|
|
|
|
|
|
| ||||
| 1.4 |
|
|
|
|
|
| ||||
DENSITY |
|
|
|
|
|
|
|
|
|
| |
|
| Midscale Neutral |
|
|
|
|
| ||||
1.0 |
|
|
|
|
|
|
|
|
|
| |
SPECTRAL |
|
|
|
|
|
|
|
|
|
| |
0.6 |
|
|
|
|
|
|
|
|
|
| |
DIFFUSE |
|
|
|
|
|
|
|
|
|
| |
0.2 |
|
|
|
|
|
| Minimum Density |
| |||
|
|
|
|
|
|
|
| ||||
|
|
|
|
|
|
|
|
|
|
| |
|
|
|
|
|
|
|
|
|
|
| |
| 300 | 350 | 400 | 450 | 500 | 550 | 600 | 650 | 700 | 750 | 800 |
H15205TE |
|
| WAVELENGTH (nm) |
|
|
| |||||
These curves depict the spectral absorptions of the dyes formed when the film is processed. They are useful for adjusting or optimizing any device that scans or prints the film.
Note: Cyan, Magenta, and Yellow Dye Curves are
NOTICE: The sensitometric curves and data in this publication represent product tested under the conditions of exposure and processing specified. They are representative of production coatings, and therefore do not apply directly to a particular box or roll of photographic material. They do not represent standards or specifications that must be met by Eastman Kodak Company. The company reserves the right to change and improve product characteristics at any time.
4 | KODAK VISION2 250D Color Negative Film 5205 / 7205 • |