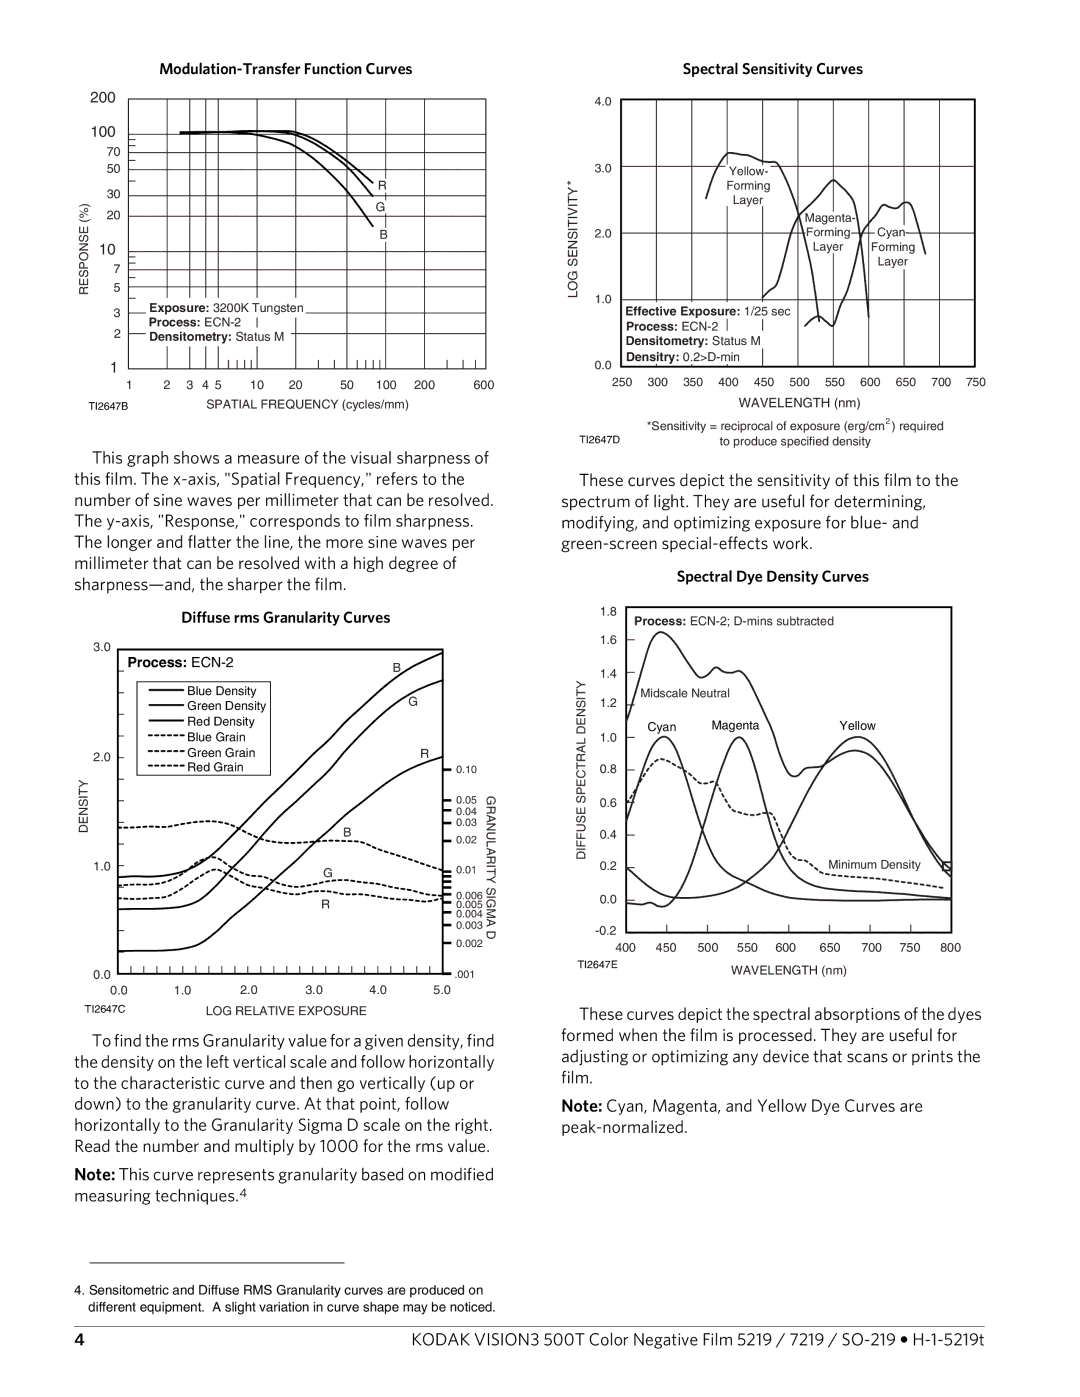
Modulation-Transfer Function Curves
200
| 100 |
| 70 |
| 50 |
| R |
| 30 |
(%) | G |
20 | |
RESPONSE | 5 |
| B |
| 10 |
| 7 |
3Exposure: 3200K Tungsten
Process: ECN-2
2Densitometry: Status M
1
1 | 2 | 3 | 4 5 | 10 | 20 | 50 | 100 | 200 | 600 |
TI2647B |
|
| SPATIAL FREQUENCY (cycles/mm) |
|
| ||||
This graph shows a measure of the visual sharpness of this film. The
Diffuse rms Granularity Curves
3.0 |
|
|
|
|
|
|
Process: |
|
| B |
| ||
|
|
|
|
|
| |
| Blue Density |
|
| G |
| |
| Green Density |
|
|
| ||
|
|
|
|
| ||
| Red Density |
|
|
|
| |
| Blue Grain |
|
|
|
| |
2.0 | Green Grain |
|
| R |
| |
| Red Grain |
|
| 0.10 |
| |
|
|
|
|
| 0.05 | GRANULARITY |
|
|
|
|
| 0.04 | |
|
|
| B |
| 0.03 | |
|
|
|
| 0.02 | ||
|
|
|
|
| ||
1.0 |
|
| G |
| 0.01 | |
DENSITY |
|
|
|
| ||
|
|
| R |
| 0.006 | SIGMA |
|
|
|
| 0.005 | ||
|
|
|
|
| 0.004 | |
|
|
|
|
| 0.003 | |
|
|
|
|
| D | |
|
|
|
|
| 0.002 | |
|
|
|
|
|
| |
0.0 |
|
|
|
| .001 |
|
0.0 | 1.0 | 2.0 | 3.0 | 4.0 | 5.0 |
|
TI2647C |
| LOG RELATIVE EXPOSURE |
|
|
| |
To find the rms Granularity value for a given density, find the density on the left vertical scale and follow horizontally to the characteristic curve and then go vertically (up or down) to the granularity curve. At that point, follow horizontally to the Granularity Sigma D scale on the right. Read the number and multiply by 1000 for the rms value.
Note: This curve represents granularity based on modified measuring techniques.4
4. Sensitometric and Diffuse RMS Granularity curves are produced on different equipment. A slight variation in curve shape may be noticed.
|
|
| Spectral Sensitivity Curves |
|
|
| |||||
| 4.0 |
|
|
|
|
|
|
|
|
|
|
* | 3.0 |
|
| Yellow- |
|
|
|
|
|
| |
|
|
| Forming |
|
|
|
|
|
| ||
SENSITIVITY |
|
|
|
|
| Layer |
|
| |||
|
|
| Layer |
|
|
|
| ||||
|
|
|
|
|
|
|
|
|
| ||
|
|
|
|
|
| Magenta- |
|
|
|
| |
| 2.0 |
|
|
|
| Forming | Cyan- |
|
| ||
|
|
|
|
|
|
| Layer | Forming |
|
| |
LOG | 1.0 |
|
|
|
|
|
|
|
|
|
|
|
|
|
|
|
|
|
|
|
|
| |
| Effective Exposure: 1/25 sec |
|
|
|
|
| |||||
| Process: |
|
|
|
|
|
|
|
| ||
| Densitometry: Status M |
|
|
|
|
|
| ||||
| Densitry: |
|
|
|
|
|
| ||||
| 0.0 |
|
|
|
|
|
|
|
|
|
|
| 250 | 300 | 350 | 400 | 450 | 500 | 550 | 600 | 650 | 700 | 750 |
|
|
|
|
| WAVELENGTH (nm) |
|
|
| |||
|
| *Sensitivity = reciprocal of exposure (erg/cm2 ) required |
| ||||||||
| TI2647D |
|
| to produce specified density |
|
|
| ||||
These curves depict the sensitivity of this film to the spectrum of light. They are useful for determining, modifying, and optimizing exposure for blue- and
Spectral Dye Density Curves
| 1.8 |
|
|
|
|
|
|
|
|
| Process: |
|
|
| |||||
| 1.6 |
|
|
|
|
|
|
|
|
DENSITY | 1.4 |
|
|
|
|
|
|
|
|
1.2 | Midscale Neutral |
|
|
|
|
|
| ||
|
|
|
|
|
|
|
| ||
1.0 | Cyan | Magenta |
| Yellow |
|
| |||
SPECTRAL |
|
|
|
|
|
|
|
| |
0.8 |
|
|
|
|
|
|
|
| |
0.6 |
|
|
|
|
|
|
|
| |
DIFFUSE |
|
|
|
|
|
|
|
| |
0.4 |
|
|
|
|
|
|
|
| |
0.2 |
|
|
|
| Minimum Density |
| |||
|
|
|
|
|
| ||||
| 0.0 |
|
|
|
|
|
|
|
|
|
|
|
|
|
|
|
|
| |
| 400 | 450 | 500 | 550 | 600 | 650 | 700 | 750 | 800 |
TI2647E |
|
| WAVELENGTH (nm) |
|
|
| |||
|
|
|
|
|
|
| |||
These curves depict the spectral absorptions of the dyes formed when the film is processed. They are useful for adjusting or optimizing any device that scans or prints the film.
Note: Cyan, Magenta, and Yellow Dye Curves are
4 | KODAK VISION3 500T Color Negative Film 5219 / 7219 / |