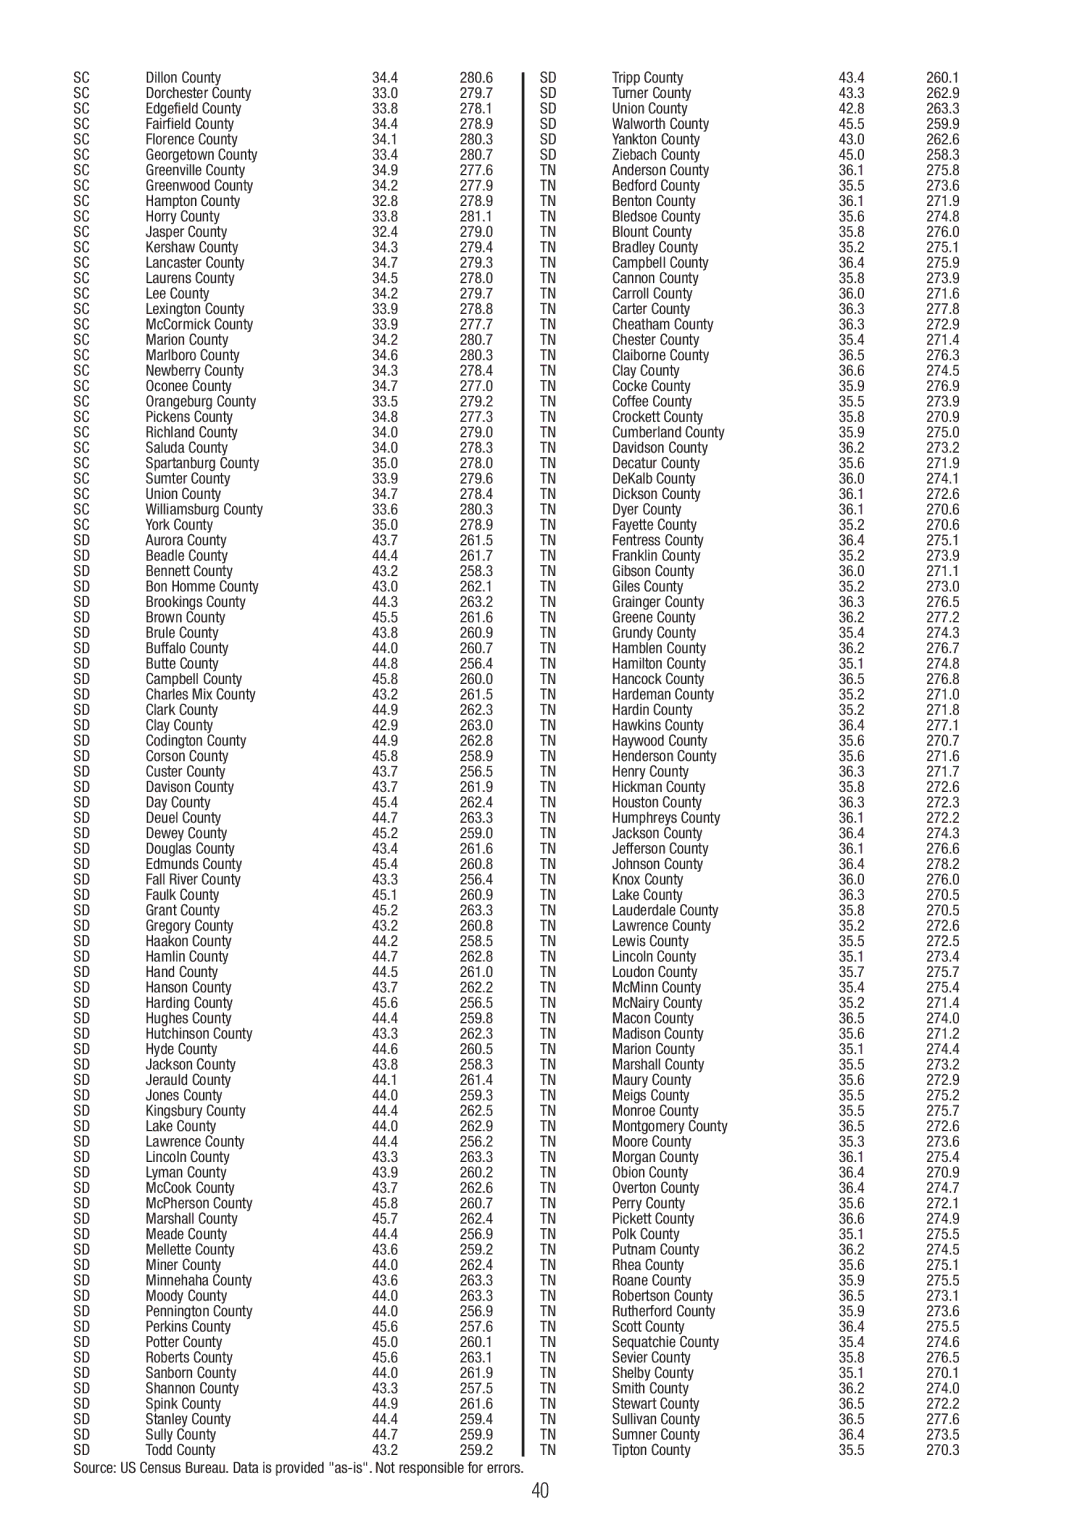
SC

Dillon County

34.4

280.6

SC

Dorchester County

33.0

279.7

SC

Edgefield County

33.8

278.1

SC

Fairfield County

34.4

278.9

SC

Florence County

34.1

280.3

SC

Georgetown County

33.4

280.7

SC

Greenville County

34.9

277.6

SC

Greenwood County

34.2

277.9

SC

Hampton County

32.8

278.9

SC

Horry County

33.8

281.1

SC

Jasper County

32.4

279.0

SC

Kershaw County

34.3

279.4

SC

Lancaster County

34.7

279.3

SC

Laurens County

34.5

278.0

SC

Lee County

34.2

279.7

SC

Lexington County

33.9

278.8

SC

McCormick County

33.9

277.7

SC

Marion County

34.2

280.7

SC

Marlboro County

34.6

280.3

SC

Newberry County

34.3

278.4

SC

Oconee County

34.7

277.0

SC

Orangeburg County

33.5

279.2

SC

Pickens County

34.8

277.3

SC

Richland County

34.0

279.0

SC

Saluda County

34.0

278.3

SC

Spartanburg County

35.0

278.0

SC

Sumter County

33.9

279.6

SC

Union County

34.7

278.4

SC

Williamsburg County

33.6

280.3

SC

York County

35.0

278.9

SD

Aurora County

43.7

261.5

SD

Beadle County

44.4

261.7

SD

Bennett County

43.2

258.3

SD

Bon Homme County

43.0

262.1

SD

Brookings County

44.3

263.2

SD

Brown County

45.5

261.6

SD

Brule County

43.8

260.9

SD

Buffalo County

44.0

260.7

SD

Butte County

44.8

256.4

SD

Campbell County

45.8

260.0

SD

Charles Mix County

43.2

261.5

SD

Clark County

44.9

262.3

SD

Clay County

42.9

263.0

SD

Codington County

44.9

262.8

SD

Corson County

45.8

258.9

SD

Custer County

43.7

256.5

SD

Davison County

43.7

261.9

SD

Day County

45.4

262.4

SD

Deuel County

44.7

263.3

SD

Dewey County

45.2

259.0

SD

Douglas County

43.4

261.6

SD

Edmunds County

45.4

260.8

SD

Fall River County

43.3

256.4

SD

Faulk County

45.1

260.9

SD

Grant County

45.2

263.3

SD

Gregory County

43.2

260.8

SD

Haakon County

44.2

258.5

SD

Hamlin County

44.7

262.8

SD

Hand County

44.5

261.0

SD

Hanson County

43.7

262.2

SD

Harding County

45.6

256.5

SD

Hughes County

44.4

259.8

SD

Hutchinson County

43.3

262.3

SD

Hyde County

44.6

260.5

SD

Jackson County

43.8

258.3

SD

Jerauld County

44.1

261.4

SD

Jones County

44.0

259.3

SD

Kingsbury County

44.4

262.5

SD

Lake County

44.0

262.9

SD

Lawrence County

44.4

256.2

SD

Lincoln County

43.3

263.3

SD

Lyman County

43.9

260.2

SD

McCook County

43.7

262.6

SD

McPherson County

45.8

260.7

SD

Marshall County

45.7

262.4

SD

Meade County

44.4

256.9

SD

Mellette County

43.6

259.2

SD

Miner County

44.0

262.4

SD

Minnehaha County

43.6

263.3

SD

Moody County

44.0

263.3

SD

Pennington County

44.0

256.9

SD

Perkins County

45.6

257.6

SD

Potter County

45.0

260.1

SD

Roberts County

45.6

263.1

SD

Sanborn County

44.0

261.9

SD

Shannon County

43.3

257.5

SD

Spink County

44.9

261.6

SD

Stanley County

44.4

259.4

SD

Sully County

44.7

259.9

SD

Todd County

43.2

259.2

SD

Tripp County

43.4

260.1

SD

Turner County

43.3

262.9

SD

Union County

42.8

263.3

SD

Walworth County

45.5

259.9

SD

Yankton County

43.0

262.6

SD

Ziebach County

45.0

258.3

TN

Anderson County

36.1

275.8

TN

Bedford County

35.5

273.6

TN

Benton County

36.1

271.9

TN

Bledsoe County

35.6

274.8

TN

Blount County

35.8

276.0

TN

Bradley County

35.2

275.1

TN

Campbell County

36.4

275.9

TN

Cannon County

35.8

273.9

TN

Carroll County

36.0

271.6

TN

Carter County

36.3

277.8

TN

Cheatham County

36.3

272.9

TN

Chester County

35.4

271.4

TN

Claiborne County

36.5

276.3

TN

Clay County

36.6

274.5

TN

Cocke County

35.9

276.9

TN

Coffee County

35.5

273.9

TN

Crockett County

35.8

270.9

TN

Cumberland County

35.9

275.0

TN

Davidson County

36.2

273.2

TN

Decatur County

35.6

271.9

TN

DeKalb County

36.0

274.1

TN

Dickson County

36.1

272.6

TN

Dyer County

36.1

270.6

TN

Fayette County

35.2

270.6

TN

Fentress County

36.4

275.1

TN

Franklin County

35.2

273.9

TN

Gibson County

36.0

271.1

TN

Giles County

35.2

273.0

TN

Grainger County

36.3

276.5

TN

Greene County

36.2

277.2

TN

Grundy County

35.4

274.3

TN

Hamblen County

36.2

276.7

TN

Hamilton County

35.1

274.8

TN

Hancock County

36.5

276.8

TN

Hardeman County

35.2

271.0

TN

Hardin County

35.2

271.8

TN

Hawkins County

36.4

277.1

TN

Haywood County

35.6

270.7

TN

Henderson County

35.6

271.6

TN

Henry County

36.3

271.7

TN

Hickman County

35.8

272.6

TN

Houston County

36.3

272.3

TN

Humphreys County

36.1

272.2

TN

Jackson County

36.4

274.3

TN

Jefferson County

36.1

276.6

TN

Johnson County

36.4

278.2

TN

Knox County

36.0

276.0

TN

Lake County

36.3

270.5

TN

Lauderdale County

35.8

270.5

TN

Lawrence County

35.2

272.6

TN

Lewis County

35.5

272.5

TN

Lincoln County

35.1

273.4

TN

Loudon County

35.7

275.7

TN

McMinn County

35.4

275.4

TN

McNairy County

35.2

271.4

TN

Macon County

36.5

274.0

TN

Madison County

35.6

271.2

TN

Marion County

35.1

274.4

TN

Marshall County

35.5

273.2

TN

Maury County

35.6

272.9

TN

Meigs County

35.5

275.2

TN

Monroe County

35.5

275.7

TN

Montgomery County

36.5

272.6

TN

Moore County

35.3

273.6

TN

Morgan County

36.1

275.4

TN

Obion County

36.4

270.9

TN

Overton County

36.4

274.7

TN

Perry County

35.6

272.1

TN

Pickett County

36.6

274.9

TN

Polk County

35.1

275.5

TN

Putnam County

36.2

274.5

TN

Rhea County

35.6

275.1

TN

Roane County

35.9

275.5

TN

Robertson County

36.5

273.1

TN

Rutherford County

35.9

273.6

TN

Scott County

36.4

275.5

TN

Sequatchie County

35.4

274.6

TN

Sevier County

35.8

276.5

TN

Shelby County

35.1

270.1

TN

Smith County

36.2

274.0

TN

Stewart County

36.5

272.2

TN

Sullivan County

36.5

277.6

TN

Sumner County

36.4

273.5

TN

Tipton County

35.5

270.3

Source: US Census Bureau. Data is provided "as-is". Not responsible for errors.

40

Page 40
Image 40
P3 International E 9300 operating instructions

E 9300 specifications

The P3 International E 9300 is an innovative energy monitoring device designed to help users take control of their energy consumption while promoting sustainable practices. This compact and user-friendly device caters to both residential and small commercial environments, making it an indispensable tool for anyone looking to reduce energy costs and environmental impact.

One of the standout features of the P3 International E 9300 is its ability to provide real-time energy usage data. The device tracks and displays information on the electricity consumption of connected appliances, enabling users to identify energy-hogging devices and make informed decisions about their usage. The large, easy-to-read LCD screen showcases important details such as voltage, wattage, amp draw, and kilowatt-hour readings, presenting a comprehensive picture of energy usage at a glance.

Incorporating advanced technologies, the P3 International E 9300 utilizes accurate sensors to ensure precise measurements. This reliability is essential for users striving to monitor their energy consumption closely. The device also features a programmable timer, which allows users to set specific intervals for appliances to be powered on or off, further maximizing energy savings. This feature is particularly beneficial for items like lights and heaters that can be managed to reduce unnecessary energy use during off-peak hours.

Another notable characteristic of the E 9300 is its plug-and-play design, which simplifies the setup process. Users can effortlessly connect the device to a standard outlet and begin monitoring their energy consumption immediately. The compact design ensures it doesn't occupy excessive space, making it a convenient addition to any area of the home or office.

For those interested in long-term energy savings, the P3 International E 9300 supports energy budgeting through its cumulative energy usage readouts. Users can track their electricity consumption over time and compare it to their set energy budgets, helping them make adjustments as needed.

Overall, the P3 International E 9300 stands out as an essential tool for conscious consumers looking to optimize their energy use. Its insightful features, accurate tracking capabilities, and user-friendly design position it as an asset for achieving greater energy efficiency and contributing to a more sustainable future. With the P3 International E 9300, users gain valuable insights into their energy habits, empowering them to make meaningful change.