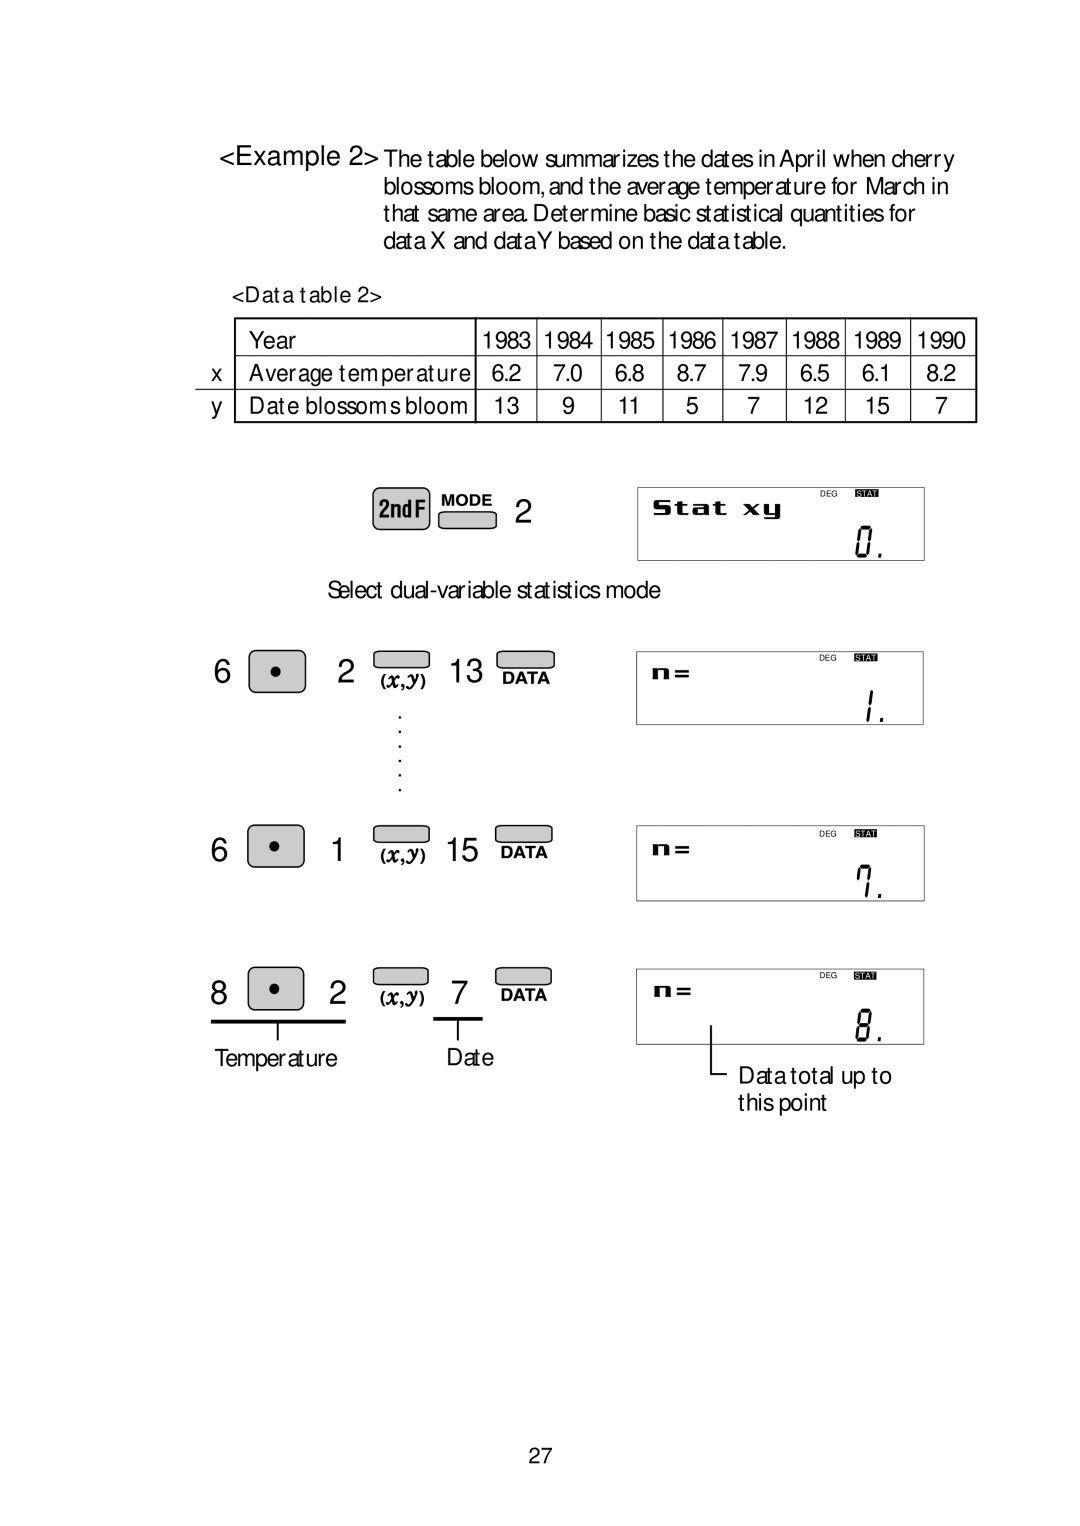
<Example 2> The table below summarizes the dates in April when cherry blossoms bloom, and the average temperature for March in that same area. Determine basic statistical quantities for data X and dataY based on the data table.
| <D ata table 2> |
|
|
|
|
|
|
|
| |
|
|
|
|
|
|
|
|
|
|
|
|
| Year | 1983 | 1984 | 1985 | 1986 | 1987 | 1988 | 1989 | 1990 |
x |
| Average temperature | 6.2 | 7.0 | 6.8 | 8.7 | 7.9 | 6.5 | 6.1 | 8.2 |
y |
| D ate blossoms bloom | 13 | 9 | 11 | 5 | 7 | 12 | 15 | 7 |
2
Select
6 ![]() 2
2 ![]() 13
13 ![]()
.
.
.
.
.
.
6 ![]() 1
1 ![]() 15
15
8 ![]() 2
2 ![]()
![]() 7
7
TemperatureDate
DEG STAT
DEG STAT
DEG STAT
DEG STAT
Data total up to this point
27
