Operating the computer [Measuring screen]
Viewing the data view and changing the settings [Menu screen]
![]()
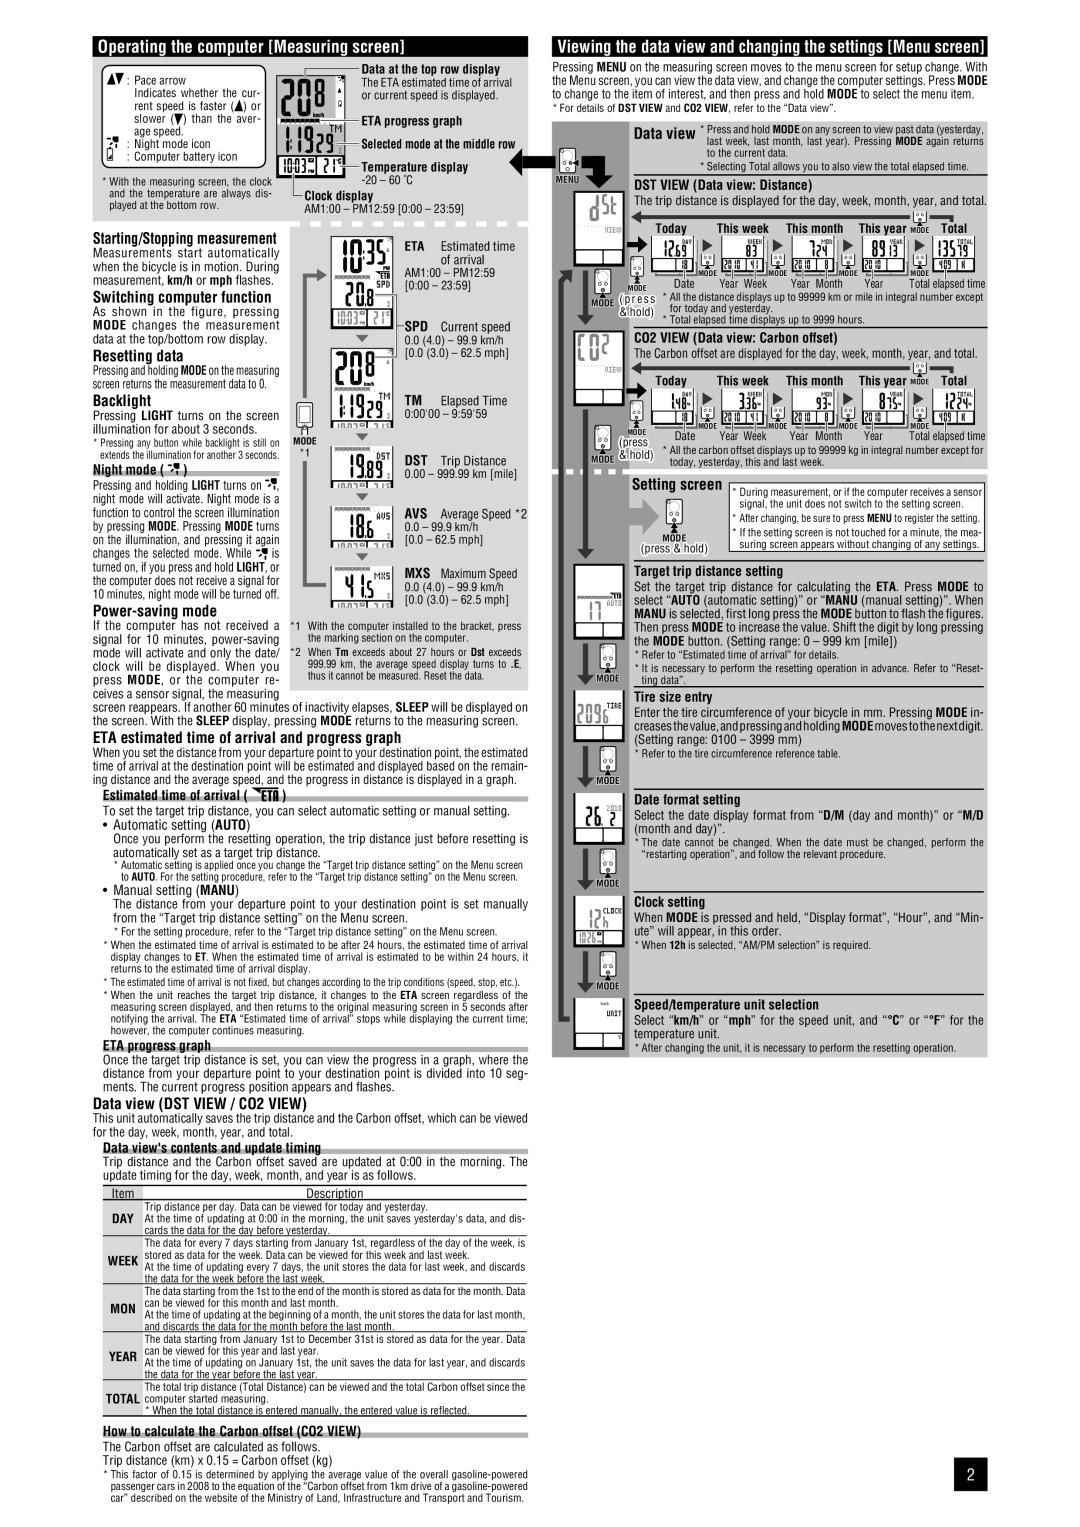
![]() : Pace arrow
: Pace arrow
Indicates whether the cur- rent speed is faster (![]() ) or slower ( ) than the aver- age speed.
) or slower ( ) than the aver- age speed.
: Night mode icon
: Computer battery icon
*With the measuring screen, the clock and the temperature are always dis- played at the bottom row.
Starting/Stopping measurement
Measurements start automatically when the bicycle is in motion. During measurement, km/h or mph flashes.
Switching computer function
As shown in the figure, pressing MODE changes the measurement data at the top/bottom row display.
Resetting data
Pressing and holding MODE on the measuring screen returns the measurement data to 0.
Backlight
Pressing LIGHT turns on the screen illumination for about 3 seconds.
*Pressing any button while backlight is still on extends the illumination for another 3 seconds.
Night mode ( 
 )
)
Pressing and holding LIGHT turns on ![]()
![]() , night mode will activate. Night mode is a function to control the screen illumination by pressing MODE. Pressing MODE turns on the illumination, and pressing it again changes the selected mode. While
, night mode will activate. Night mode is a function to control the screen illumination by pressing MODE. Pressing MODE turns on the illumination, and pressing it again changes the selected mode. While ![]()
![]() is turned on, if you press and hold LIGHT, or the computer does not receive a signal for 10 minutes, night mode will be turned off.
is turned on, if you press and hold LIGHT, or the computer does not receive a signal for 10 minutes, night mode will be turned off.
Power-saving mode
Data at the top row display
The ETA estimated time of arrival or current speed is displayed.
![]()
![]()
![]()
![]()
![]()
![]()
![]()
![]()
![]() ETA progress graph
ETA progress graph
![]()
![]()
![]()
![]()
![]()
![]()
![]()
![]()
![]() Selected mode at the middle row
Selected mode at the middle row
![]()
![]()
![]() Temperature display
Temperature display
Clock display
AM1:00 – PM12:59 [0:00 – 23:59]
|
|
|
|
|
|
|
| ETA | Estimated time |
|
|
|
|
|
|
|
|
| of arrival |
|
|
|
|
|
|
|
| AM1:00 – PM12:59 | |
|
|
|
|
|
|
|
| [0:00 – 23:59] | |
|
|
|
|
|
|
|
| SPD | Current speed |
|
|
|
|
|
|
|
| ||
|
|
|
|
|
|
|
| ||
|
|
|
|
|
|
|
| 0.0 (4.0) – 99.9 km/h | |
|
|
|
|
|
|
|
| [0.0 (3.0) – 62.5 mph] | |
|
|
|
|
|
|
|
| TM | Elapsed Time |
|
|
|
|
|
|
| |||
|
|
|
|
|
|
|
| 0:00'00 – 9:59'59 | |
|
|
|
|
|
|
|
|
|
|
MODE |
|
|
|
|
| ||||
*1 |
|
|
|
|
| DST | Trip Distance | ||
|
|
|
|
|
|
|
| ||
|
|
|
|
|
|
|
| 0.00 – 999.99 km [mile] | |
|
|
|
|
|
|
|
|
|
|
AVS Average Speed *2
0.0 – 99.9 km/h
[0.0 – 62.5 mph]
MXS Maximum Speed
0.0 (4.0) – 99.9 km/h
[0.0 (3.0) – 62.5 mph]
Pressing MENU on the measuring screen moves to the menu screen for setup change. With the Menu screen, you can view the data view, and change the computer settings. Press MODE to change to the item of interest, and then press and hold MODE to select the menu item.
* For details of DST VIEW and CO2 VIEW, refer to the “Data view”.
Data view * Press and hold MODE on any screen to view past data (yesterday, last week, last month, last year). Pressing MODE again returns to the current data.
* Selecting Total allows you to also view the total elapsed time.
MENU | DST VIEW (Data view: Distance) |
|
The trip distance is displayed for the day, week, month, year, and total.
Today | This week This month This year MODE Total |
MODE | MODE | MODE | MODE |
| MODE | Date | Year Week | Year Month | Year | Total elapsed time |
MODE | ( p r e s s | * All the distance displays up to 99999 km or mile in integral number except | ||||
& hold) | for today and yesterday. |
|
|
| ||
|
|
|
| |||
| * Total elapsed time displays up to 9999 hours. |
| ||||
CO2 VIEW (Data view: Carbon offset)
The Carbon offset are displayed for the day, week, month, year, and total.
Today | This week This month This year MODE Total |
| MODE | MODE | MODE | MODE |
| MODE |
| Date | Year Week | Year Month | Year | Total elapsed time | |
| (press | |||||
| * All the carbon offset displays up to 99999 kg in integral number except for | |||||
MODE | & hold) | |||||
| today, yesterday, this and last week. |
|
| |||
Setting screen * During measurement, or if the computer receives a sensor
signal, the unit does not switch to the setting screen.
* After changing, be sure to press MENU to register the setting.
MODE | * If the setting screen is not touched for a minute, the mea- | |
suring screen appears without changing of any settings. | ||
(press & hold) | ||
|
Target trip distance setting
Set the target trip distance for calculating the ETA. Press MODE to select “AUTO (automatic setting)” or “MANU (manual setting)”. When MANU is selected, first long press the MODE button to flash the figures.
If the computer has not received a | *1 | With the computer installed to the bracket, press |
signal for 10 minutes, |
| the marking section on the computer. |
mode will activate and only the date/ | *2 | When Tm exceeds about 27 hours or Dst exceeds |
clock will be displayed. When you |
| 999.99 km, the average speed display turns to .E, |
press MODE, or the computer re- |
| thus it cannot be measured. Reset the data. |
ceives a sensor signal, the measuring
screen reappears. If another 60 minutes of inactivity elapses, SLEEP will be displayed on the screen. With the SLEEP display, pressing MODE returns to the measuring screen.
ETA estimated time of arrival and progress graph
When you set the distance from your departure point to your destination point, the estimated time of arrival at the destination point will be estimated and displayed based on the remain- ing distance and the average speed, and the progress in distance is displayed in a graph.
Estimated time of arrival (  )
)
To set the target trip distance, you can select automatic setting or manual setting.
•Automatic setting (AUTO)
Once you perform the resetting operation, the trip distance just before resetting is automatically set as a target trip distance.
*Automatic setting is applied once you change the “Target trip distance setting” on the Menu screen to AUTO. For the setting procedure, refer to the “Target trip distance setting” on the Menu screen.
•Manual setting (MANU)
The distance from your departure point to your destination point is set manually from the “Target trip distance setting” on the Menu screen.
*For the setting procedure, refer to the “Target trip distance setting” on the Menu screen.
*When the estimated time of arrival is estimated to be after 24 hours, the estimated time of arrival display changes to ET. When the estimated time of arrival is estimated to be within 24 hours, it returns to the estimated time of arrival display.
*The estimated time of arrival is not fixed, but changes according to the trip conditions (speed, stop, etc.).
*When the unit reaches the target trip distance, it changes to the ETA screen regardless of the measuring screen displayed, and then returns to the original measuring screen in 5 seconds after notifying the arrival. The ETA “Estimated time of arrival” stops while displaying the current time; however, the computer continues measuring.
ETA progress graph
Once the target trip distance is set, you can view the progress in a graph, where the distance from your departure point to your destination point is divided into 10 seg- ments. The current progress position appears and flashes.
Data view (DST VIEW / CO2 VIEW)
This unit automatically saves the trip distance and the Carbon offset, which can be viewed for the day, week, month, year, and total.
Data view's contents and update timing
Trip distance and the Carbon offset saved are updated at 0:00 in the morning. The update timing for the day, week, month, and year is as follows.
Item | Description |
Trip distance per day. Data can be viewed for today and yesterday.
DAY At the time of updating at 0:00 in the morning, the unit saves yesterday's data, and dis- cards the data for the day before yesterday.
The data for every 7 days starting from January 1st, regardless of the day of the week, is WEEK stored as data for the week. Data can be viewed for this week and last week.
At the time of updating every 7 days, the unit stores the data for last week, and discards the data for the week before the last week.
The data starting from the 1st to the end of the month is stored as data for the month. Data MON can be viewed for this month and last month.
At the time of updating at the beginning of a month, the unit stores the data for last month, and discards the data for the month before the last month.
The data starting from January 1st to December 31st is stored as data for the year. Data YEAR can be viewed for this year and last year.
At the time of updating on January 1st, the unit saves the data for last year, and discards the data for the year before the last year.
The total trip distance (Total Distance) can be viewed and the total Carbon offset since the TOTAL computer started measuring.
* When the total distance is entered manually, the entered value is reflected.
How to calculate the Carbon offset (CO2 VIEW)
Then press MODE to increase the value. Shift the digit by long pressing the MODE button. (Setting range: 0 – 999 km [mile])
*Refer to “Estimated time of arrival” for details.
*It is necessary to perform the resetting operation in advance. Refer to “Reset-
MODE | ting data”. |
Tire size entry
Enter the tire circumference of your bicycle in mm. Pressing MODE in- creasesthevalue,andpressingandholdingMODEmovestothenextdigit. (Setting range: 0100 – 3999 mm)
* Refer to the tire circumference reference table.
![]() MODE
MODE![]()
Date format setting
Select the date display format from “D/M (day and month)” or “M/D (month and day)”.
*The date cannot be changed. When the date must be changed, perform the “restarting operation”, and follow the relevant procedure.
![]() MODE
MODE![]()
Clock setting
When MODE is pressed and held, “Display format”, “Hour”, and “Min- ute” will appear, in this order.
* When 12h is selected, “AM/PM selection” is required.
![]() MODE
MODE![]()
Speed/temperature unit selection
Select “km/h” or “mph” for the speed unit, and “°C” or “°F” for the temperature unit.
* After changing the unit, it is necessary to perform the resetting operation.
The Carbon offset are calculated as follows. |
| |
Trip distance (km) x 0.15 = Carbon offset (kg) |
| |
2 | ||
* This factor of 0.15 is determined by applying the average value of the overall | ||
passenger cars in 2008 to the equation of the “Carbon offset from 1km drive of a |
|
car” described on the website of the Ministry of Land, Infrastructure and Transport and Tourism.