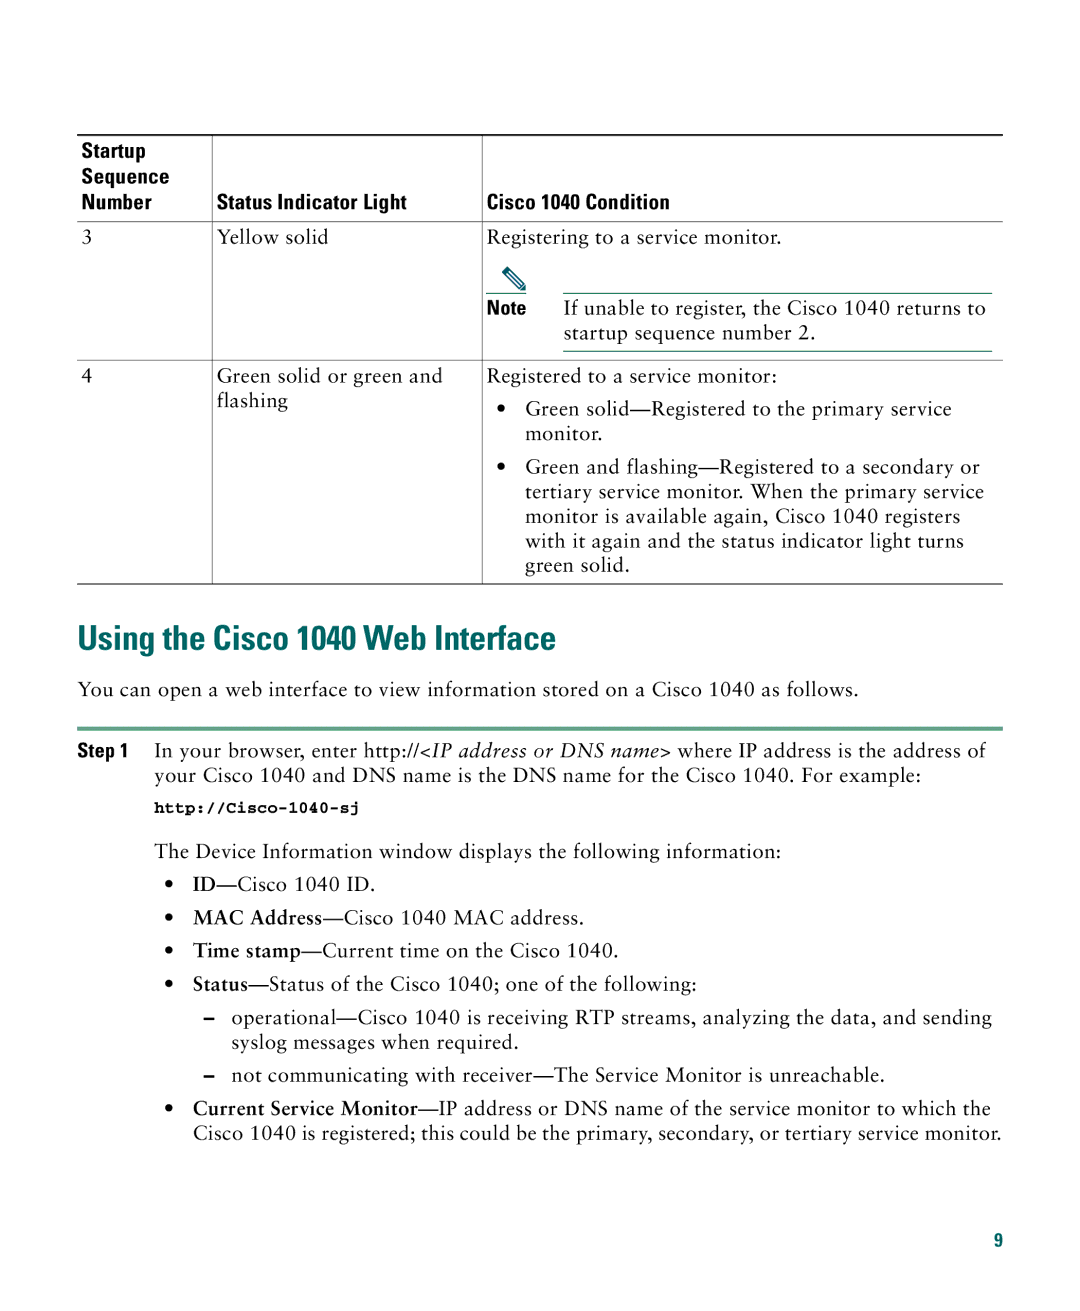
1040 specifications
Cisco Systems is renowned for its cutting-edge networking equipment, and the Cisco 1040 series is no exception. The Cisco 1040 access points are designed to support both modern wireless requirements and the performance needs of businesses and organizations of all sizes. These devices are particularly noteworthy for their robust feature set, advanced technologies, and flexibility.One of the standout features of the Cisco 1040 is its ability to provide dual-band wireless connectivity, operating simultaneously on both 2.4 GHz and 5 GHz frequency bands. This capability ensures that users can enjoy optimal performance and reduced interference, catering to diverse applications ranging from simple internet browsing to bandwidth-intensive video streaming. The 802.11ac technology underlying the 1040 series allows for exceptional wireless speeds and enhanced capacity.
Enhanced security is another critical aspect of the Cisco 1040. Equipped with advanced security protocols, including WPA3, the access points provide reliable protection against unauthorized access and ensure secure data transmission. This focus on security is essential in today’s environment where business networks are increasingly targeted by cyber threats.
Cisco’s Intelligent Wireless Technology is also integrated into the 1040 access points. This technology employs machine learning algorithms to optimize wireless performance continually. It automatically adjusts network settings based on current load and user behavior, ensuring a consistently superior wireless experience.
In terms of deployment, the Cisco 1040 series is designed for ease of use. The devices are compatible with Cisco's Prime Infrastructure for centralized management, enabling IT administrators to easily monitor and configure the network. Additionally, the access points support Power over Ethernet (PoE), simplifying installation by allowing them to receive power through the Ethernet cable.
Moreover, the Cisco 1040 is versatile and can be used in various environments. From small offices to larger enterprises, its sleek design and efficient performance make it an ideal solution for enhancing connectivity. With features like automatic RF management, dynamic channel allocation, and client load balancing, businesses can be confident that they are investing in a reliable and scalable wireless solution.
Overall, the Cisco 1040 series is designed to meet the demanding needs of today's wireless environments. With its focus on performance, security, and ease of management, it’s a top choice for businesses looking to upgrade their network infrastructure. Whether for office use or educational settings, the Cisco 1040 delivers a comprehensive wireless solution that keeps pace with modern technological demands.

