WOMen
age | excellent | good | moderate | overweight | obese |
|
|
|
|
|
|
<19 | 17.0 | 17.1 to 22.0 | 22.1 to 27.0 | 27.1 to 32.0 | >32.1 |
|
|
|
|
|
|
18.0 | 18.1 to 23.0 | 23.1 to 28.0 | 28.1 to 33.0 | >33.1 | |
|
|
|
|
|
|
19.0 | 19.1 to 24.0 | 24.1 to 29.0 | 29.1 to 34.0 | >34.1 | |
|
|
|
|
|
|
20.0 | 20.1 to 25.0 | 25.1 to 30.0 | 30.1 to 35.0 | >35.1 | |
|
|
|
|
|
|
> 50 | 21.0 | 21.1 to 26.0 | 26.1 to 31.0 | 31.1 to 36.0 | >36.1 |
|
|
|
|
|
|
From Principles and Labs for Physical Fitness and Wellness, 1st Edition, ©1999. Reprinted with permission of Wadsworth, a division of Thomson Learning.
Body Water/Hydration Levels
General health standards indicate that one should consume approximately 64 oz. of water per day to maintain a healthy level of hydration. According to the World Health Organization (WHO, 2001), the percentage of body water should lie within the following ranges:
Women:
Men:
Children:
Maintaining these levels will help improve your overall health and general feeling of
Body Water/Hydration Level – how is it measured?
The hydration level is measured by using Bioelectric Impedance Analysis (BIA). The same analysis that is used to calculate your body fat is used to calculate your hydration level. The Thinner Body Water microprocessor again measures impedance or transmission speed through water. Taking into consideration a user’s age and gender, a calculation is made that determines the percentage of water.
Please Note: It is not recommended to take the hydration measurements in certain situations, such as following exercise, after drinking a glass of water, or directly prior to, during, or shortly after menstrual cycles. Hydration may not be at its normal level during these times. If you have any questions or concerns about your readings, contact your healthcare provider.
Bone Mass – What Is It?
Bone is a living, growing tissue. During youth, your body makes new bone tissue faster than it breaks down older bone. In young adulthood, bone mass is at its peak; after that, bone loss starts to outpace bone growth, and bone mass decreases. But it’s a long and a very slow process that can be slowed down even more through
Who should monitor bone mass?
Most people have no need to monitor bone mass, but certain groups
–postmenopausal women, men and women with certain diseases, and anyone who takes medications that affect bone tissue might want to watch for any decrease in bone mass.
How to monitor bone mass at home
Program your Thinner® Body Analysis Monitor and watch as
Typical ranges for bone mass:
Men:
The bone mass reading is to be used as a guide only. Watch for trends over time and contact your healthcare provider for a more detailed explanation of the readings, and with any questions or concerns.
Service Centers | Conair Corporation |
Conair Corporation | |
Service Department | Service Department |
150 Milford Road | 7475 N. Glen Harbor Blvd. |
East Windsor, NJ 08520 | Glendale, AZ 85307 |
©2008 Conair Corporation, East Windsor, NJ 08520, Glendale, AZ 85307 Made in China
TH404
The Scale with
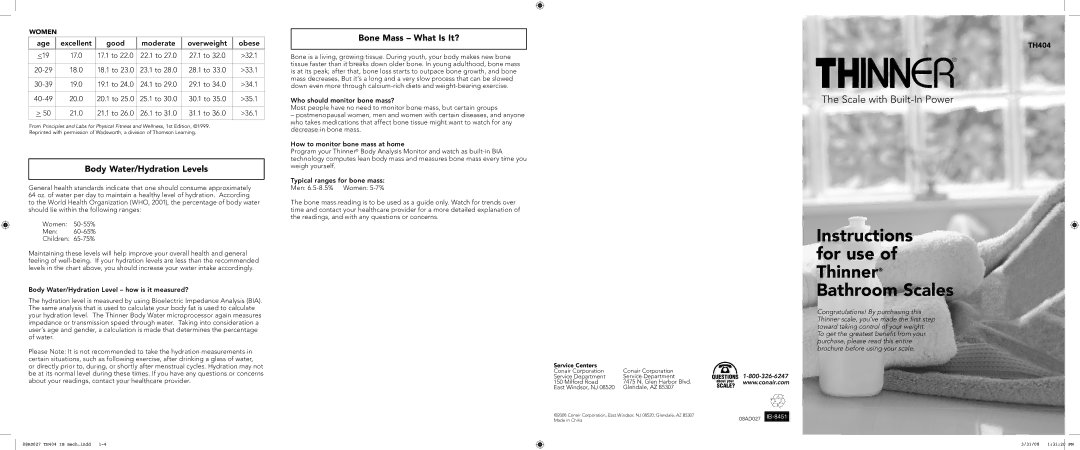
Instructions for use of Thinner® Bathroom Scales
Congratulations! By purchasing this Thinner scale, you’ve made the first step toward taking control of your weight.
To get the greatest benefit from your purchase, please read this entire brochure before using your scale.
08AD027
08AD027 TH404 IB mech.indd
3/31/08 1:31:20 PM
