J F 6 0 z S p e c i f i c a t i o n s
group · J
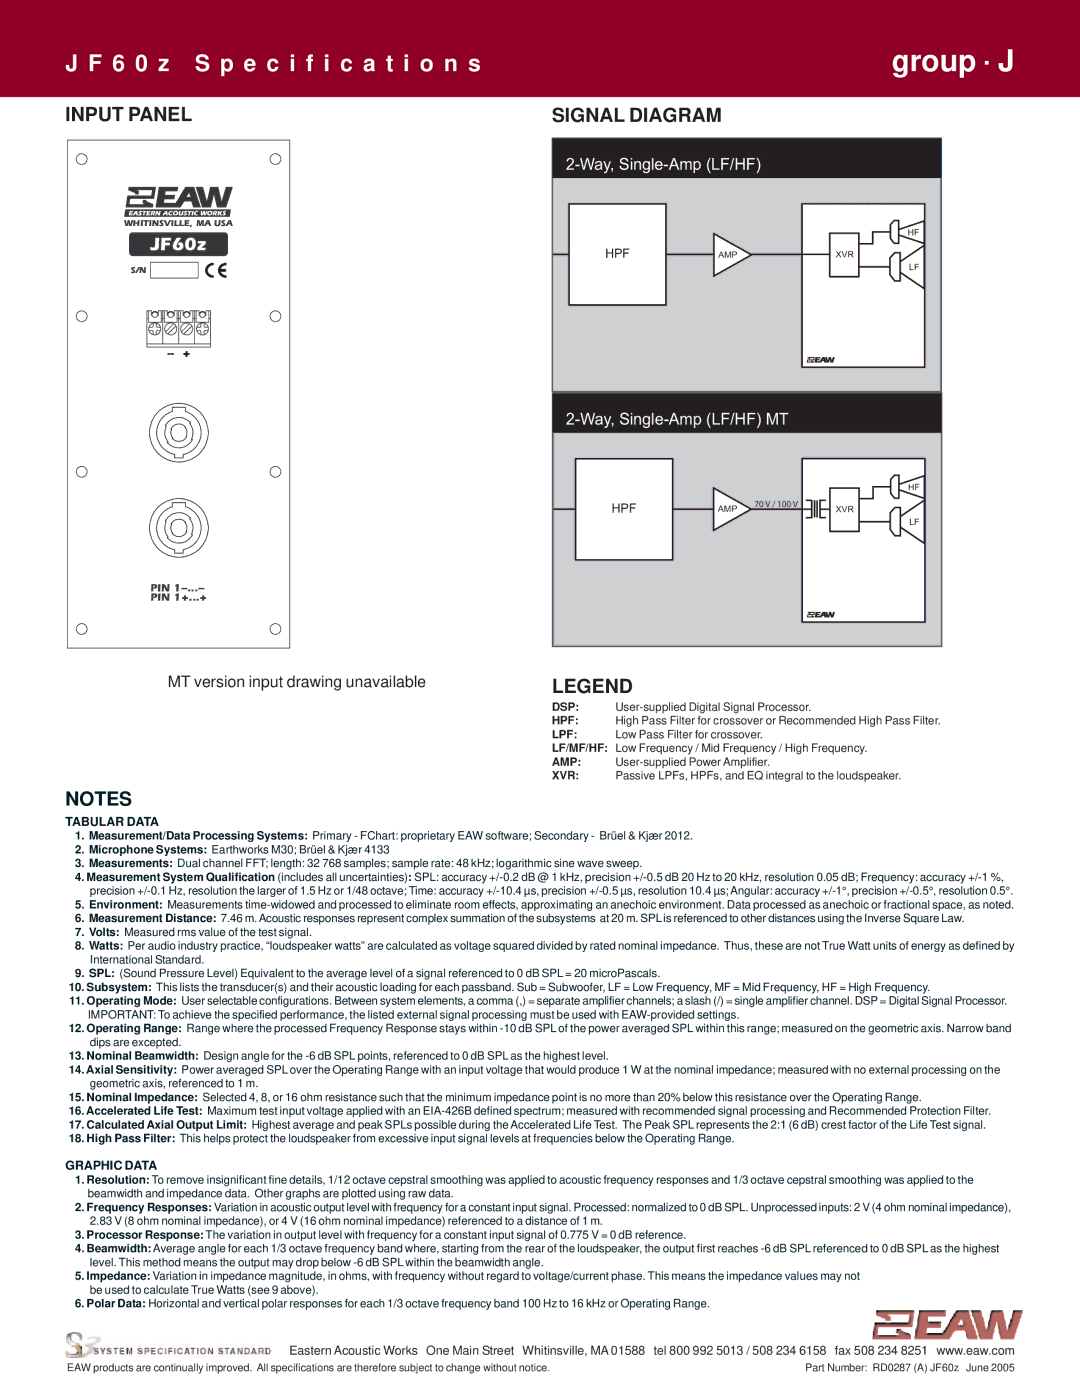
INPUT PANEL | SIGNAL DIAGRAM |
|
| ||||
WHITINSVILLE, MA USA |
|
|
|
| HF |
JF60z |
|
|
|
| |
HPF | AMP |
| XVR | ||
|
| ||||
S/N |
|
|
|
| LF |
|
|
|
|
| |
|
|
| |||
|
|
|
|
| HF |
|
| HPF | AMP | 70 V / 100 V | XVR |
|
|
| |||
|
|
|
|
| LF |
PIN |
|
|
|
|
|
PIN 1+...+ |
|
|
|
|
|
MT version input drawing unavailable | LEGEND |
|
|
| |
| DSP: |
| |||
| HPF: | High Pass Filter for crossover or Recommended High Pass Filter. | |||
| LPF: | Low Pass Filter for crossover. |
| ||
| LF/MF/HF: | Low Frequency / Mid Frequency / High Frequency. | |||
| AMP: |
| |||
| XVR: | Passive LPFs, HPFs, and EQ integral to the loudspeaker. | |||
NOTES
TABULAR DATA
1.Measurement/Data Processing Systems: Primary - FChart: proprietary EAW software; Secondary - Brüel & Kjær 2012.
2.Microphone Systems: Earthworks M30; Brüel & Kjær 4133
3.Measurements: Dual channel FFT; length: 32 768 samples; sample rate: 48 kHz; logarithmic sine wave sweep.
4.Measurement System Qualification (includes all uncertainties): SPL: accuracy
precision
5.Environment: Measurements
6.Measurement Distance: 7.46 m. Acoustic responses represent complex summation of the subsystems at 20 m. SPLis referenced to other distances using the Inverse Square Law.
7.Volts: Measured rms value of the test signal.
8.Watts: Per audio industry practice, “loudspeaker watts” are calculated as voltage squared divided by rated nominal impedance. Thus, these are not True Watt units of energy as defined by International Standard.
9.SPL: (Sound Pressure Level) Equivalent to the average level of a signal referenced to 0 dB SPL = 20 microPascals.
10.Subsystem: This lists the transducer(s) and their acoustic loading for each passband. Sub = Subwoofer, LF = Low Frequency, MF = Mid Frequency, HF = High Frequency.
11.Operating Mode: User selectable configurations. Between system elements, a comma (,) = separate amplifier channels; a slash (/) = single amplifier channel. DSP = Digital Signal Processor.
IMPORTANT: To achieve the specified performance, the listed external signal processing must be used with
12.Operating Range: Range where the processed Frequency Response stays within
13.Nominal Beamwidth: Design angle for the
14.Axial Sensitivity: Power averaged SPL over the Operating Range with an input voltage that would produce 1 W at the nominal impedance; measured with no external processing on the geometric axis, referenced to 1 m.
15.Nominal Impedance: Selected 4, 8, or 16 ohm resistance such that the minimum impedance point is no more than 20% below this resistance over the Operating Range.
16.Accelerated Life Test: Maximum test input voltage applied with an
17.Calculated Axial Output Limit: Highest average and peak SPLs possible during the Accelerated Life Test. The Peak SPL represents the 2:1 (6 dB) crest factor of the Life Test signal.
18.High Pass Filter: This helps protect the loudspeaker from excessive input signal levels at frequencies below the Operating Range.
GRAPHIC DATA
1.Resolution: To remove insignificant fine details, 1/12 octave cepstral smoothing was applied to acoustic frequency responses and 1/3 octave cepstral smoothing was applied to the beamwidth and impedance data. Other graphs are plotted using raw data.
2.Frequency Responses: Variation in acoustic output level with frequency for a constant input signal. Processed: normalized to 0 dB SPL. Unprocessed inputs: 2 V (4 ohm nominal impedance),
2.83V (8 ohm nominal impedance), or 4 V (16 ohm nominal impedance) referenced to a distance of 1 m.
3.Processor Response: The variation in output level with frequency for a constant input signal of 0.775 V = 0 dB reference.
4.Beamwidth: Average angle for each 1/3 octave frequency band where, starting from the rear of the loudspeaker, the output first reaches
5.Impedance: Variation in impedance magnitude, in ohms, with frequency without regard to voltage/current phase. This means the impedance values may not
be used to calculate True Watts (see 9 above).
6.Polar Data: Horizontal and vertical polar responses for each 1/3 octave frequency band 100 Hz to 16 kHz or Operating Range.
Eastern Acoustic Works One Main Street Whitinsville, MA 01588 tel 800 992 5013 / 508 234 6158 fax 508 234 8251 www.eaw.com
EAW products are continually improved. All specifications are therefore subject to change without notice. | Part Number: RD0287 (A) JF60z June 2005 |