Application Engineering |
|
|
|
B U L L E | T | I | N |
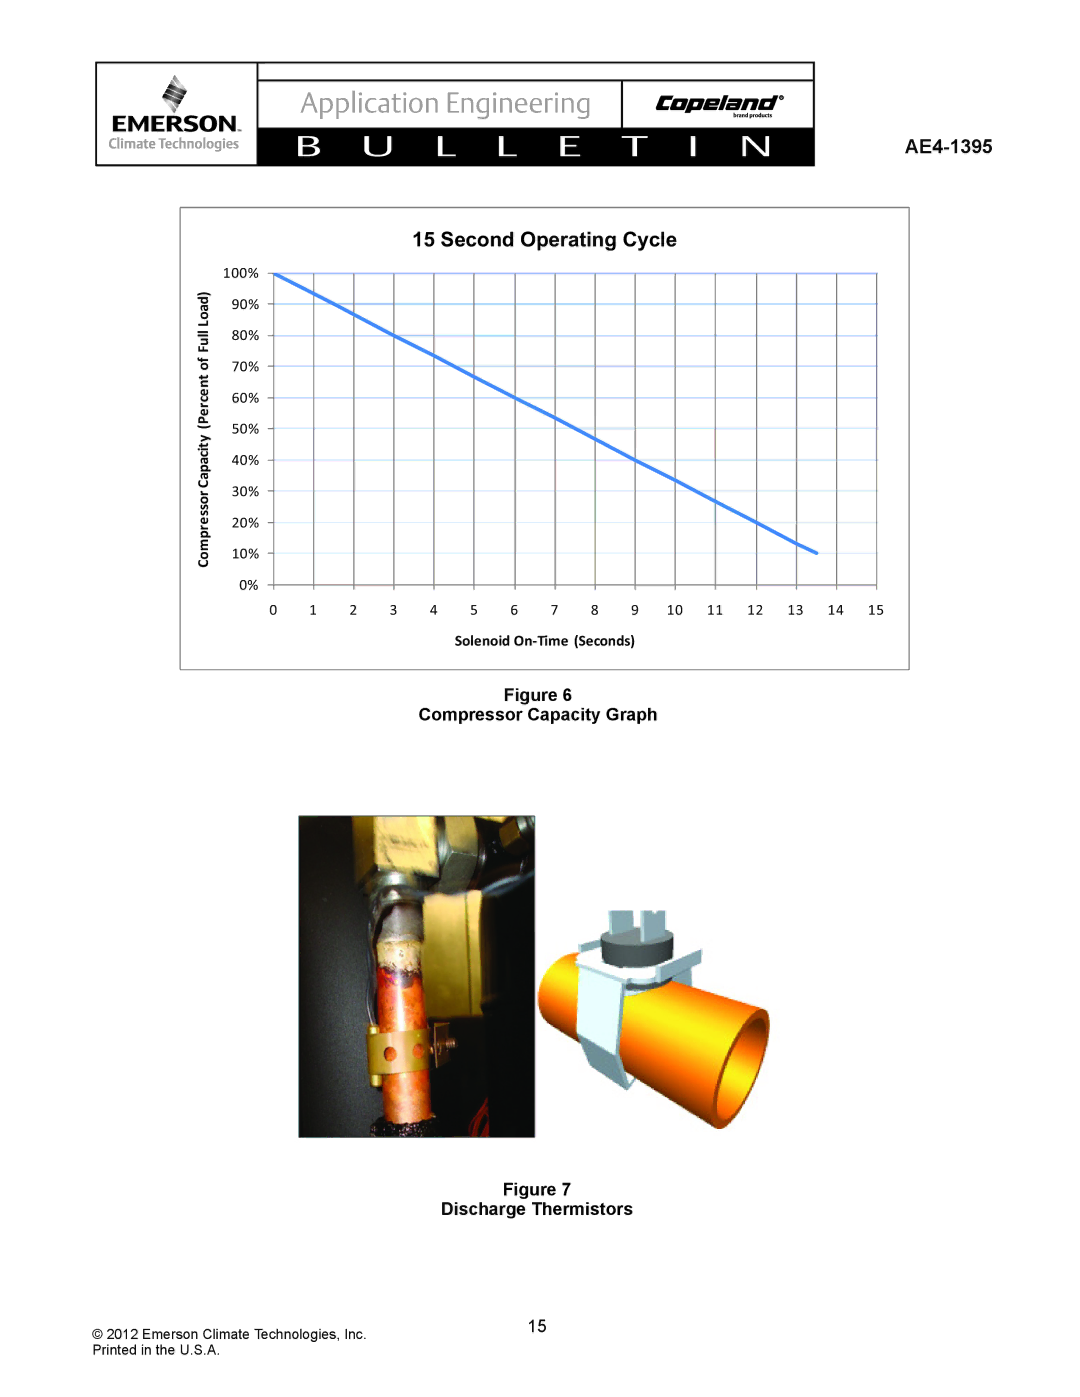
15 Second Operating Cycle
AE4-1395
| 100% |
|
|
|
|
|
|
|
|
|
|
|
|
|
|
|
Load) | 90% |
|
|
|
|
|
|
|
|
|
|
|
|
|
|
|
80% |
|
|
|
|
|
|
|
|
|
|
|
|
|
|
| |
of Full |
|
|
|
|
|
|
|
|
|
|
|
|
|
|
| |
70% |
|
|
|
|
|
|
|
|
|
|
|
|
|
|
| |
(Percent |
|
|
|
|
|
|
|
|
|
|
|
|
|
|
| |
60% |
|
|
|
|
|
|
|
|
|
|
|
|
|
|
| |
50% |
|
|
|
|
|
|
|
|
|
|
|
|
|
|
| |
Capacity |
|
|
|
|
|
|
|
|
|
|
|
|
|
|
| |
40% |
|
|
|
|
|
|
|
|
|
|
|
|
|
|
| |
30% |
|
|
|
|
|
|
|
|
|
|
|
|
|
|
| |
Compressor |
|
|
|
|
|
|
|
|
|
|
|
|
|
|
| |
20% |
|
|
|
|
|
|
|
|
|
|
|
|
|
|
| |
10% |
|
|
|
|
|
|
|
|
|
|
|
|
|
|
| |
|
|
|
|
|
|
|
|
|
|
|
|
|
|
|
| |
| 0% |
|
|
|
|
|
|
|
|
|
|
|
|
|
|
|
| 0 | 1 | 2 | 3 | 4 | 5 | 6 | 7 | 8 | 9 | 10 | 11 | 12 | 13 | 14 | 15 |
Solenoid
Figure 6
Compressor Capacity Graph
© 2012 Emerson Climate Technologies, Inc. Printed in the U.S.A.
Figure 7
Discharge Thermistors
15