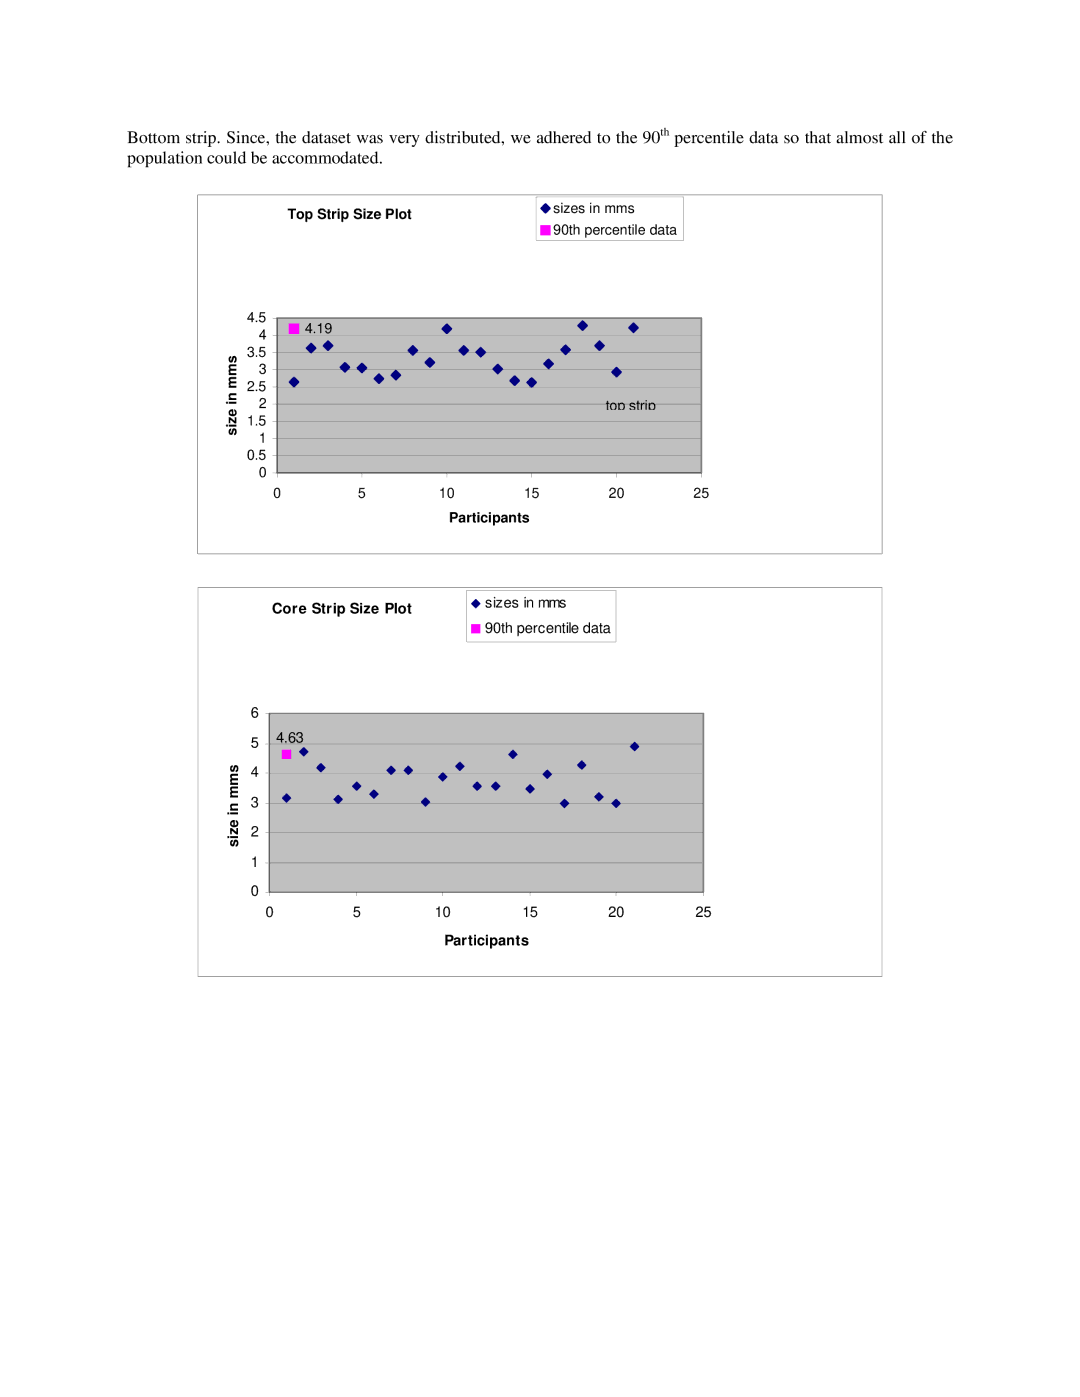
Bottom strip. Since, the dataset was very distributed, we adhered to the 90th percentile data so that almost all of the population could be accommodated.
size in mms
size in mms
Top Strip Size Plot |
|
| sizes in mms |
|
| 90th percentile data | |
|
|
| |
|
|
| |
|
|
|
4.5 | 4.19 |
|
|
|
|
4 |
|
|
|
| |
|
|
|
|
| |
3.5 |
|
|
|
|
|
3 |
|
|
|
|
|
2.5 |
|
|
|
|
|
2 |
|
|
| top strip |
|
1.5 |
|
|
|
|
|
1 |
|
|
|
|
|
0.5 |
|
|
|
|
|
0 |
|
|
|
|
|
0 | 5 | 10 | 15 | 20 | 25 |
Participants
Core Strip Size Plot |
|
| sizes in mms |
|
| 90th percentile data | |
|
|
| |
|
|
| |
|
|
|
|
6
5 4.63
4
3
2
1
0
0 | 5 | 10 | 15 | 20 | 25 |
Participants