HP-UX Linker and Libraries Users Guide
Page
Contents
Contents
Creating and Using Libraries
Linker Tools for Itanium-Based Systems
Linker Tools for PA-RISC Systems
Contents
Shared Library Management Routines 136
Contents
Contents
Writing and Generating Position-Independent Code 185
Using Mapfiles 191
Improving Your Application Performance 202
Glossary 225
Intended Audience
Document conventions and symbols
Related Information
Document conventions
Document Organization
HP Encourages Your Comments
Improving Your Application Performance
Using Mapfiles
Compiling Programs on HP-UX An Example
Overview
This chapter addresses the following
Compiling Programs on HP-UX An Example
Looking Inside a Compiler
What is an Object File?
Local Definitions
Compiler-Linker Interaction
Global Definitions
External References
Cc Entering Link editor
Crt0.o Startup File
Linking Programs on HP-UX
Magic Numbers PA-RISC only
A.out File
Programs Entry Point
Linker uses four startup files
Library Naming Conventions Default Libraries Link Order
32-bit Mode Magic Number Linker Options
Linking with Libraries
File Permissions
Default Library Search Path
Default Libraries
Library Naming Conventions
Link Order
Running the Program
Deferred Binding is the Default
Loading Programs exec
Binding Routines to a Program
Linker Thread-Safe Features
Determining How to Link Programs or Libraries Linker Tasks
Using the Compiler to Link
Changing the Default Library Search Path with -Wl, -L
Example Using -Wl, -L
Example Using -Wl
Passing Linker Options from the Compiler Command with -Wl
Getting Verbose Output with
Renaming the Output File with -o
Suppressing the Link-Edit Phase with -c
Using Linker Commands
Linking with the crt0.o Startup File in 32-bit mode PA-RISC
Overriding the Default Linker Search Path with Lpath
Using $ORIGIN
Augmenting the Default Linker Search Path with -L
Augmenting the Default Linker Search Path with +origin
Example Using -B immediate
Changing the Default Shared Library Binding with -B
Nonfatal Shared Library Binding with -B nonfatal
Restricted Shared Library Binding with -B restricted
Shared Library Binding with -B group
Direct Shared Library Binding with -B direct
Lazydirect Shared Library Binding with -B lazydirect
Shared Library Binding with -B nodelete
Example Using -B symbolic
Improving Shared Library Performance with -B symbolic
Comparing -B symbolic with -h and +e
Case 1 Building a Shared Library with -B symbolic
Symbol Hidden in a Shared Library
Or export the convertrtn symbol
Example Using -a
Option Settings to -a
Choosing Archive or Shared Libraries with -a
Linking Shared Libraries with -dynamic
Example Using +e
Exporting Symbols with +e
When to use -h versus +e
Linking Archived Libraries with -noshared
Exporting Symbols with +ee
Exporting Symbols from main with -E
Emitting debug information in a separate file
Hiding Symbols with -h
Hiding Symbols from Export with +hideallsymbols
Example Using -h
Tips on Using -h
Hiding and Exporting Symbols When Building a Shared Library
Hiding Symbols when Combining .o Files with the -r Option
Hiding and Exporting Symbols when Creating an a.out File
Moving Libraries after Linking with +b
Not Recording Link Time Paths with +nodefaultrapth
Specifying a Path List with +b
Syntax of the +b option is
Path List
Ignoring Dynamic Path Environment Variables with +noenvvar
Moving Libraries After Linking with +s and Shlibpath
Specifying a Path List with +s and Shlibpath
For more information Path List
Controlling Archive Library Loading with +noforceload
Thereafter, the following commands would be equivalent
Passing Linker Options in a file with -c
Passing Linker Options with Ldopts
Using the -l option
Flagging Unsatisfied Symbols with +noallowunsats
Example Using -l
Specifying Libraries with -l and -l
Using the IPF Linker with +compat or +std
Using the Linker with +compat for Compatibility Mode
Controlling Output from the Unwind Table with +strip unwind
Dynamicflag is passed to shlload
Using the Linker with +std for Standard Mode
Linking in PA-32 Mode with +compat
Linking in PA-64 Mode with +std
Changing Mapfiles with -k and +nodefaultmap
Selecting Verbose Output with +vtype
All
Creating read-only text segment in Mpas executable
Turning on the linkage table protection with +protect
Allocating Storage for Uninitialized Data with +nobss
Initializing Floating Point Environment with +FP
Flags that are supported
Turn Off Linker Warnings with -w
Linker toolset for Itanium-Based systems
Changing a Programs Attributes with chatr1
Options to change various attributes
Libname
Immediate
+as mode
Deferred
+b flag
+protect disable
Enabledisable
+md flag
+memcheck
Viewing Symbols in an Object file with nm1
Format
Viewing the Contents of an Object File with elfdump1
+linkmapbss
+linkmap
+linkmapfile
+objdebug
Symbol
Symbol resolution problems to stderr
Viewing Library Dependencies with ldd1
+T num2
Listing Dynamic Libraries with pldd1
Example 3 Using the ldd command
Options to view information specified files
Printing a Stack Trace with pstack1
Level with level
Parameter
Example 6 Calling pstack with -level option
Example 5 Calling pstack with a process id
Linker Tools for Itanium-Based Systems
Viewing the Size of Object File Elements with size1
Reducing Storage Space with strip1
Example 9 Calling pstack with special argument
Options to control the amount of information stripped
Improving Program Start-up with fastbind1
Finding Object Library Ordering Relationships with lorder1
Tracing Inter-Module Procedure Calls with ltrace1
Example 10 Example
Example 11 Examples
$/usr/ccs/bin/ltrace ./a.out -a arg1 arg2 arg3 .. argn
Using chatr for 32-bit Program Attributes
For the 32-bit compatible syntax
Using chatr for 64-bit Program Attributes
+dz
For the 64-bit only syntax
+si
+sa
$THISSHORTBSS$
Example 12 Viewing Symbols in an Object file with nm1
To view
Optional list of symbol resolution problems to stderr
Example 13 Viewing library dependencies with ldd1
To display
Before you ran fastbind on it
Example 14 Improving Program Start-up with fastbind1
$ ar cr library `lorder *.o tsort`
ELF Object File Format
PA-RISC Changes in Hardware Compatibility
PA-RISC 2.0 Compatibility
PA-RISC Architectures and Their System Models
Versions of PA-RISC architecture
+nosrcpos
+objdebug mode
PA64 Mode Linker Options
Linker-Defined Symbols
This section describes the PA64 mode linker options
Dynamic Path Searching for Shared Libraries
Symbol names
Runpath
Perform 32-bit link
PA-64, IPF 64-bit mode example
Symbol Searching in Dependent Libraries
System Libraries Locations and Library Name Extension
System Library Location
Shared Library Extension suffix
Statically-bound programs archive-bound programs
Overview of Shared and Archive Libraries
Using Libraries on HP-UX
Creating Libraries on HP-UX
Creating Archive Libraries Creating Shared Libraries
Out files
What are Archive Libraries?
Default Behavior When Searching for Libraries at Run Time
What are Shared Libraries?
Dynamic Loader
Running setuid Programs
Example Program Comparing Shared and Archive Libraries
Two Processes Sharing libc
Profiling Shared Libraries with gprof1
Creating Archive Libraries
Overview of Creating an Archive Library
Contents of an Archive File
Example of Creating an Archive Library
Replacing, Adding, and Deleting an Object Module
Summary of Keys to the ar1 Command
Replacing or Adding an Object Module
Deleting an Object Module
Using /usr/local/lib or /usr/contrib/lib
Using /usr/lib and /usr/lib/pa2064
Creating Shared Libraries
Archive Library Location IPF
Creating Position-Independent Code PIC
Example Using +z
Creating the Shared Library with ld
Comparing +z and +Z
Order in Which Libraries are Loaded Load Graph
Shared Library Dependencies
LibD
Placing Loaded Libraries in the Search List
Shared Library Location IPF
Updating a Shared Library
Improving Shared Library Performance
Incompatible Changes to a Shared Library
Consider a case where a.out has the following dependents
That is, a.out is built with commands like these
Ldpreload Example
Symbol resolution order for the user libraries is
Ldpreload Example PA-RISC
Bit Behavior
Out -- libA.sl -- libC.sl -- libD.sl -- libB.sl
Using Profile-Based Optimization on Shared Libraries
Exporting Only the Required Symbols
Placing Frequently-Called Routines Together
Making Shared Libraries Non-Writable
Using the +ESlit/+Olit=all Option to cc
Y.o
None
+condrodata Command-Line Option
Using Filtered Shared Libraries 32-bit Mode Only
Building Filtered Shared Libraries
Initializers
Run time behavior of filtered shared libraries
When to Use Shared Library Versioning
Version Control with Shared Libraries
Function Level Versioning
How to Use Library-Level Versioning
Maintaining Old Versions of Library Modules
Library-Level Versioning
File System Links to Shared Libraries
Creating a New, Incompatible Version of the Library
+h Option and Internal Names
Then set up the corresponding file system links
Using shlload3X with Library-Level Versioning
Intra-Library Versioning PA-RISC only
Version Number Compiler Directive
Adding New Versions to a Shared Library
Shared Library Dependencies and Version Control
#pragma Hpshlibversion date
$SHLIBVERSION date
Switching from Archive to Shared Libraries
Relying on Undocumented Linker Behavior
Specifying a Version Date
Stack Usage
Absolute Virtual Addresses
Version Control
Debugger Limitations
Using the chroot Command with Shared Libraries
Summary of HP-UX Libraries
Profiling Limitations
Example 1 Unsatisfied Symbols Compiling
Example 1 Unsatisfied Symbols
Example 1 Unsatisfied Symbols Modifying a Function
Example 1 Unsatisfied Symbols Creating the Executable
Example 1 Unsatisfied Symbols Problem of Unsatisfied Symbol
Example 2 Using shlload3X
Example 2 Using shlload3X Creating the Executable
Example 3 Hidden Definitions
Example 2 Using shlload3X Rebuilding the Shared Library
Example 3 Hidden Definitions Compiling
Example 3 Hidden Definitions Modifying a Function
Using Shared Libraries in Default Mode
Dthpneeded entry
Internal Name Processing
Shared Library Symbol Binding Semantics
Link-Time Symbol Resolution in Shared Libraries
Dynamic Path Searching for Shared Libraries
Resolution of Unsatisfied Shared Library References
If these files are compiled and linked as
PA-32 linker toolset produces
Promotion of Uninitialized Global Data Items
Symbol Searching in Dependent Libraries
Search Order of Dependent Libraries
Mixed Mode Shared Libraries
Libfile4.so
IPF Library Examples
Library example IPF Dynamic Path Searching
Following example builds a standard mode library
Library Example IPF Compatibility Mode Link
You can use chatr+s to enable a.out in file1 and file2
For the following libraries with dependencies
Linking Libraries with +b pathlist
Linker issues the following error message
When linking main.o, the link order is 1. ./libbar.so found
Above example, if you type
Instead
Dlopen Routines Summary
Shared Library Management Routine Summaries
Do not mix use of the shlload and dlopen APIs
Dl* routines for shared library management
Shared Library Header Files
Related Files and Commands
Shlload Routine Summary
Routines for shared library management
Initializers for Shared Libraries
Using Shared Libraries with cc and ld Options
Styles of Initializers
Init/Fini Style Initializers
Using Init/Fini Initializers
HP-UX-10.X Style Initializers
Init and Fini Usage Example
Source for lib1.so file lib1.c lib1
Finis from any .o files used in my64bit.a
Ordering Within an Executable or Shared Library
Ordering Among Executables and Shared Libraries
Using HP-UX 10.X Style Initializers
Declaring the Initializer with the +I Option
Order of Execution of Multiple Initializers
Accessing Initializers Addresses
Initializer Syntax
Example An Initializer for Each Library
Source for testlib.c #include stdio.h #include dl.h main
Source for Initializer file init.c #include dl.h
Example a Common Initializer for Multiple Libraries
Following are the commands used to build these libraries
Dlopen Shared Library Management Routines
Following is the command to create the executable testlib2
Dlopen Routine
Syntax
Parameters
Return Values
Description
Dlopen Shared Library Management Routines
Using dlopen to load a shared library
Synopsis
Dlsetlibpath Routine
Using dlsetlibpath to set the dynamic search path
Rtldflagdisablestdpath Rtldflagdisablecwdpath
Dlerrno Routine
Errors
Dlgetfileinfo Routine
Multithread Usage
Shared Library Management Routines
Dlerror Routine
Using dlerror to get diagnostic information
Dlsym Routine
Handle
Usage
Index
Dlget Routine
Desc
Descsize
Dlmodinfo Routine
Using dlget to retrieve information about loaded modules
Dlgetname Routine
Using dlmodinfo to retrieve information about a load module
Dlclose Routine
Using dlgetname to retrieve pathname
Dlclose routine closes a shared library
Int dlclosevoid *handle
Using dlclose to unload a shared library
Dladdr routine gets the symbolic information for an address
Dladdr Routine
Diagnostics
Using dladdr to get the symbolic information for an address
Following example shows how to use dladdr to
Dlmodadd Routine
Dlmodremove removes information registered using dlmodadd
Dlmodremove Routine
Dlgetmodinfo Routine
Following example shows how to use dlgetmodinfo
Using dlgetmodinfo
Shlload Routine
Shlload Shared Library Management Routines
Parameters
Shlload routine explicitly loads a library
Enomem
Shlload Usage
Shlload Example
Loadlib Function to Load a Shared Library
Bindverbose Modifier
Bindnonfatal Modifier
Bindfirst Modifier
Dynamicpath Modifier
Shlfindsym Routine
LibG together and correctly resolves all symbols
Bindtogether Modifier
Bindbreadthfirst Modifier
Handle = Null
Shlt handle
Shlfindsym&handle,foo
Same as Typedata
Shlfindsym Example
Index
Shlget and shlgetr Routines
Example
Shldefinesym Routine
Shlgethandle and shlgethandler Routines
Shlgetsymbols Routine
Typeprocedure
Showsymbols Display Shared Library Symbols
Shlsymbol Structure
Members of the shlsymbol structure are defined as follows
Example 17 shlgetsymbols Example
Showall Use showsymbols to Show All Symbols
Showall program shown above was compiled with the command
Output produced by running this program is shown below
Fpumodelstorage
Shlunload Routine
Unsupported Shared Library Management Routines
Dynamic Loader Compatibility Warnings
Unsupported Shared Library Management Flags
Shlunload Routine Returning Etxtbsy
Typeprocedure Typedata Typestorage
What is a Absolute Object Code?
What is a Relocatable Object Code?
Generating Position-Independent Code
What is a Position-Independent Code?
PIC Requirements for Compilers and Assembly Code
Long Calls
Long Branches and Switch Tables
Assigned Goto Statements
Literal References
Global and Static Variable References
Procedure Labels
Writing and Generating Position-Independent Code
Changing Mapfiles with -k filename and +nodefaultmap
Mapfile Example Using -k mapfile and +nodefaultmap
Controlling Mapfiles with the -k Option
Using Mapfiles
IPF 32-bit linker uses the following default mapfile
Default HP-UX 11.0 Release Mapfile
Simple Mapfile
Following directives show how a simple mapfile would appear
Using Mapfiles
Defining Syntax for Mapfile Directives
Segment Flags
Defining Mapfile Segment Declarations
Attributes and their values
Segment declarations support the following segment flags
Defining Mapfile Section Mapping Directives
Mapfile Segment Declaration Examples
Section attributes and their valid values are as follows
Placement of Segments in an Executable
Internal Map Structure
Mapping Input Sections to Segments
Map Structure
Fatal Errors
Mapfile Option Error Messages
Mapfile Option Error Messages
Invoking Linker Optimizations from the Compile Line
Linker Optimizations
Unused Procedure Elimination with +Oprocelim
Incompatibilities with other Options
Complete Executables
Profile-Based Optimization PA-RISC
Using PBO
When to Use PBO
How to Use PBO
Instrumenting +I/-I
Startup File icrt0.o
-I Linker Option
Code Generation from I-SOMs
Building Portable Code with Linker Optimization
Profiling
Storing Profile Information for Multiple Programs
-P Linker Option
Optimizing Based on Profile Data +P/-P
Specifying a Different flow.data File with +df
Using The flow.data File
Specifying a Different flow.data with Flowdata
Interaction between Flowdata and +df
Selecting an Optimization Level with PBO
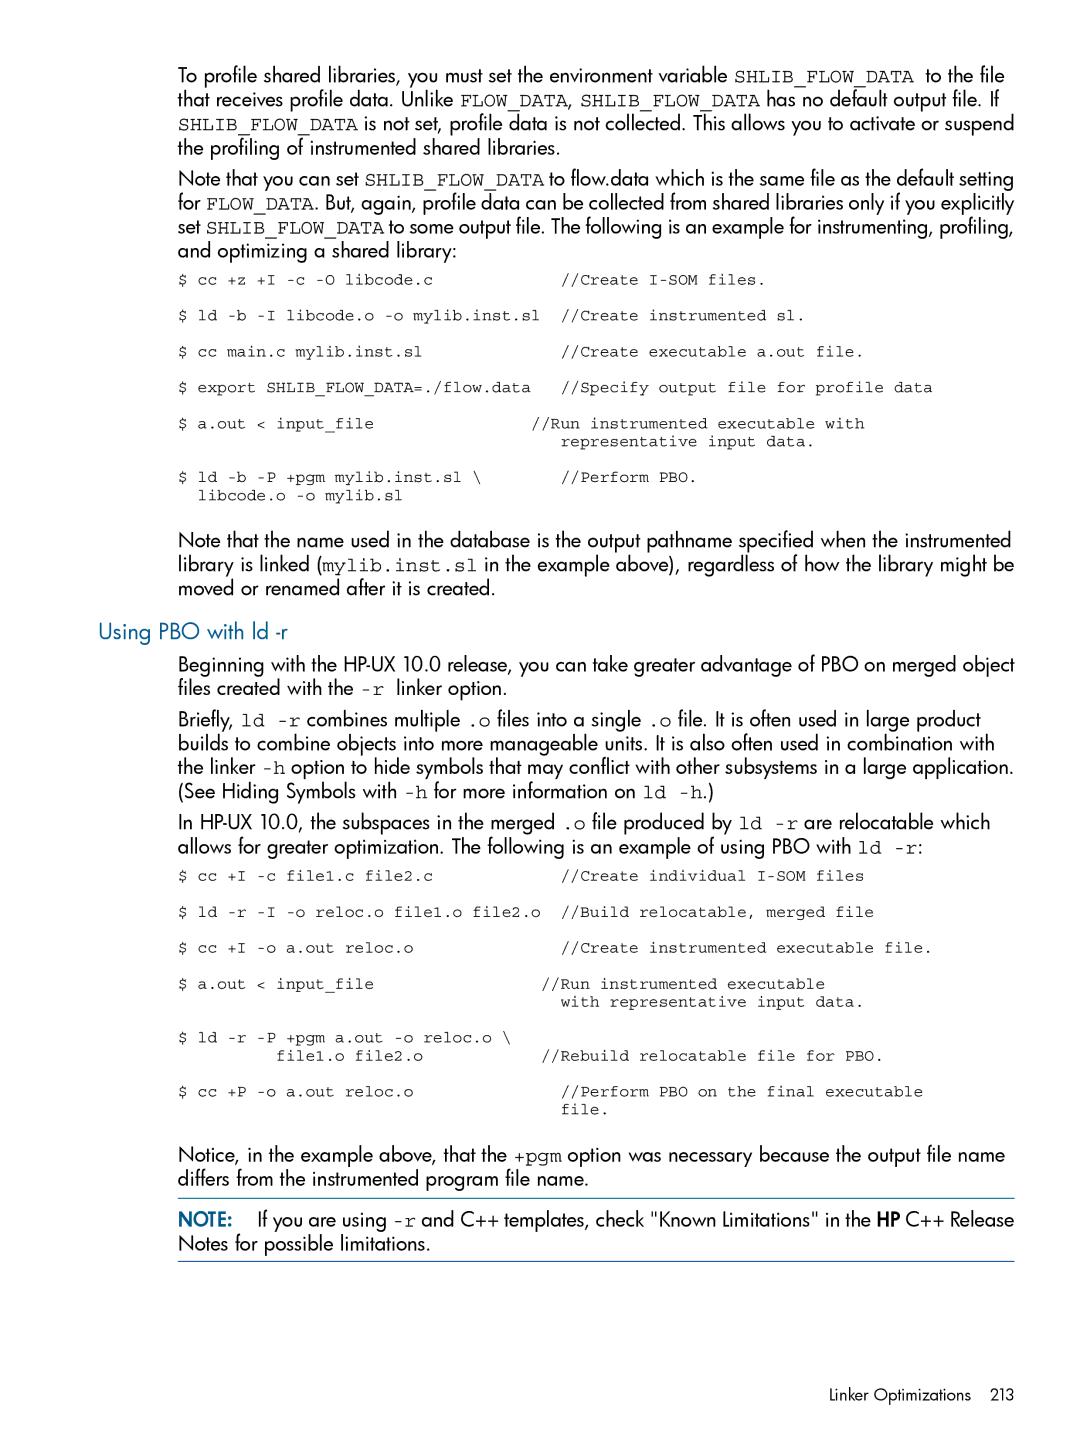
Using PBO to Optimize Shared Libraries
Using PBO with ld -r
Restrictions and Limitations of PBO
Size
Essentially empty
Compatibility with 9.0 PBO
Profile-Based Optimization Itanium
Options to Improve TLB Hit Rates
Incremental Linking
Example 19 Examples
Any of the padding spaces have been exhausted
Archive Library Processing
Using Incremental Linking Options
Shared Library Processing
Performance
Improving Performance with the Global Symbol Table
Reusing Compiled Object Files PA-RISC
Improving Performance by Optimizing the Hash Table Size
Using fastbind
Improving Performance with Function Symbol Aliasing
Improving Shared Library Start-Up Time with fastbind
Example 20 Example
Invoking the fastbind Tool
How to Tell if fastbind Information is Current
Invoking fastbind from the Linker
Example 21 Example
Turning off fastbind at Run Time
Removing fastbind Information from a File
Example 22 Example
See the fastbind1 man
Glossary
SOM
PBO
Rpath