5.2.  Measurement options
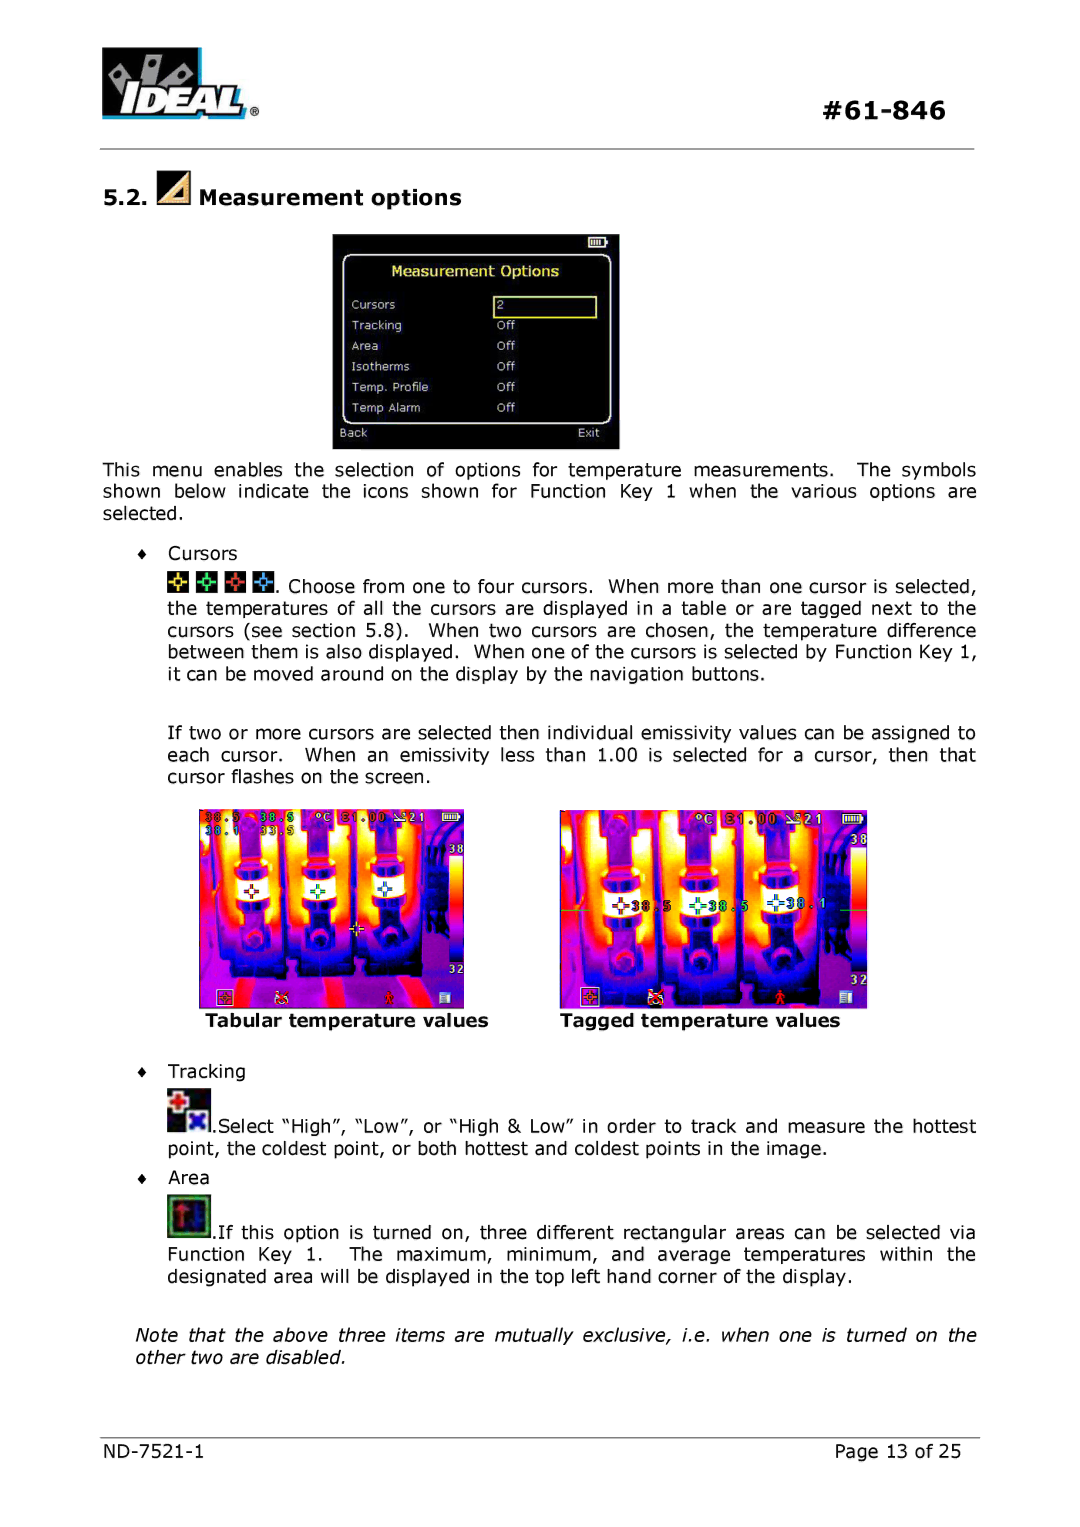
This menu enables the selection of options for temperature measurements. The symbols shown below indicate the icons shown for Function Key 1 when the various options are selected.
![]() Cursors
Cursors
![]()
![]()
![]()
![]() . Choose from one to four cursors. When more than one cursor is selected, the temperatures of all the cursors are displayed in a table or are tagged next to the cursors (see section 5.8). When two cursors are chosen, the temperature difference between them is also displayed. When one of the cursors is selected by Function Key 1, it can be moved around on the display by the navigation buttons.
. Choose from one to four cursors. When more than one cursor is selected, the temperatures of all the cursors are displayed in a table or are tagged next to the cursors (see section 5.8). When two cursors are chosen, the temperature difference between them is also displayed. When one of the cursors is selected by Function Key 1, it can be moved around on the display by the navigation buttons.
If two or more cursors are selected then individual emissivity values can be assigned to each cursor. When an emissivity less than 1.00 is selected for a cursor, then that cursor flashes on the screen.
Tabular temperature values | Tagged temperature values |
![]() Tracking
Tracking
![]() .Select “High”, “Low”, or “High & Low” in order to track and measure the hottest point, the coldest point, or both hottest and coldest points in the image.
.Select “High”, “Low”, or “High & Low” in order to track and measure the hottest point, the coldest point, or both hottest and coldest points in the image.
![]() Area
Area
![]() .If this option is turned on, three different rectangular areas can be selected via Function Key 1. The maximum, minimum, and average temperatures within the designated area will be displayed in the top left hand corner of the display.
.If this option is turned on, three different rectangular areas can be selected via Function Key 1. The maximum, minimum, and average temperatures within the designated area will be displayed in the top left hand corner of the display.
Note that the above three items are mutually exclusive, i.e. when one is turned on the other two are disabled.
Page 13 of 25 |