GENERAL INFORMATION
APPLICATION
The QP3TZ Trash Pump is designed to be used for dewatering applications. Both the suction and discharge ports on the QP3TZ trash pump use a
Trash or
Engine
This trash pump is powered by a 6.8 horsepower,
Trash Pump
Trash pumps derive their name from their ability to handle a greater amount of debris and solids than standard centrifugal pumps.This pump generally handle solids up to 1/2 the size of the discharge opening making them less likely to clog. Also trash pumps are capable of handling water with 25% solids by weight.
The advantage of using a trash pump is that it can be quickly and easily disassembled in the field "without tools" and easily cleaned when clogged.
Suction Lift
This pump is intended to be used for dewatering applications and is capable of suction lifts up to 25 feet at sea level. For optimal suction lift performance, keep the suction hose or line as short as possible. In general, always place the pump as close to the water as possible.
Pump Support
The pump should always be placed on solid stationary ground in a level position.
NEVER place the pump on soft soil. The suction hose or pipe connection should always be checked for tightness and leaks. A small suction leak in the hose or fittings could prevent the pump from priming.
Elevation
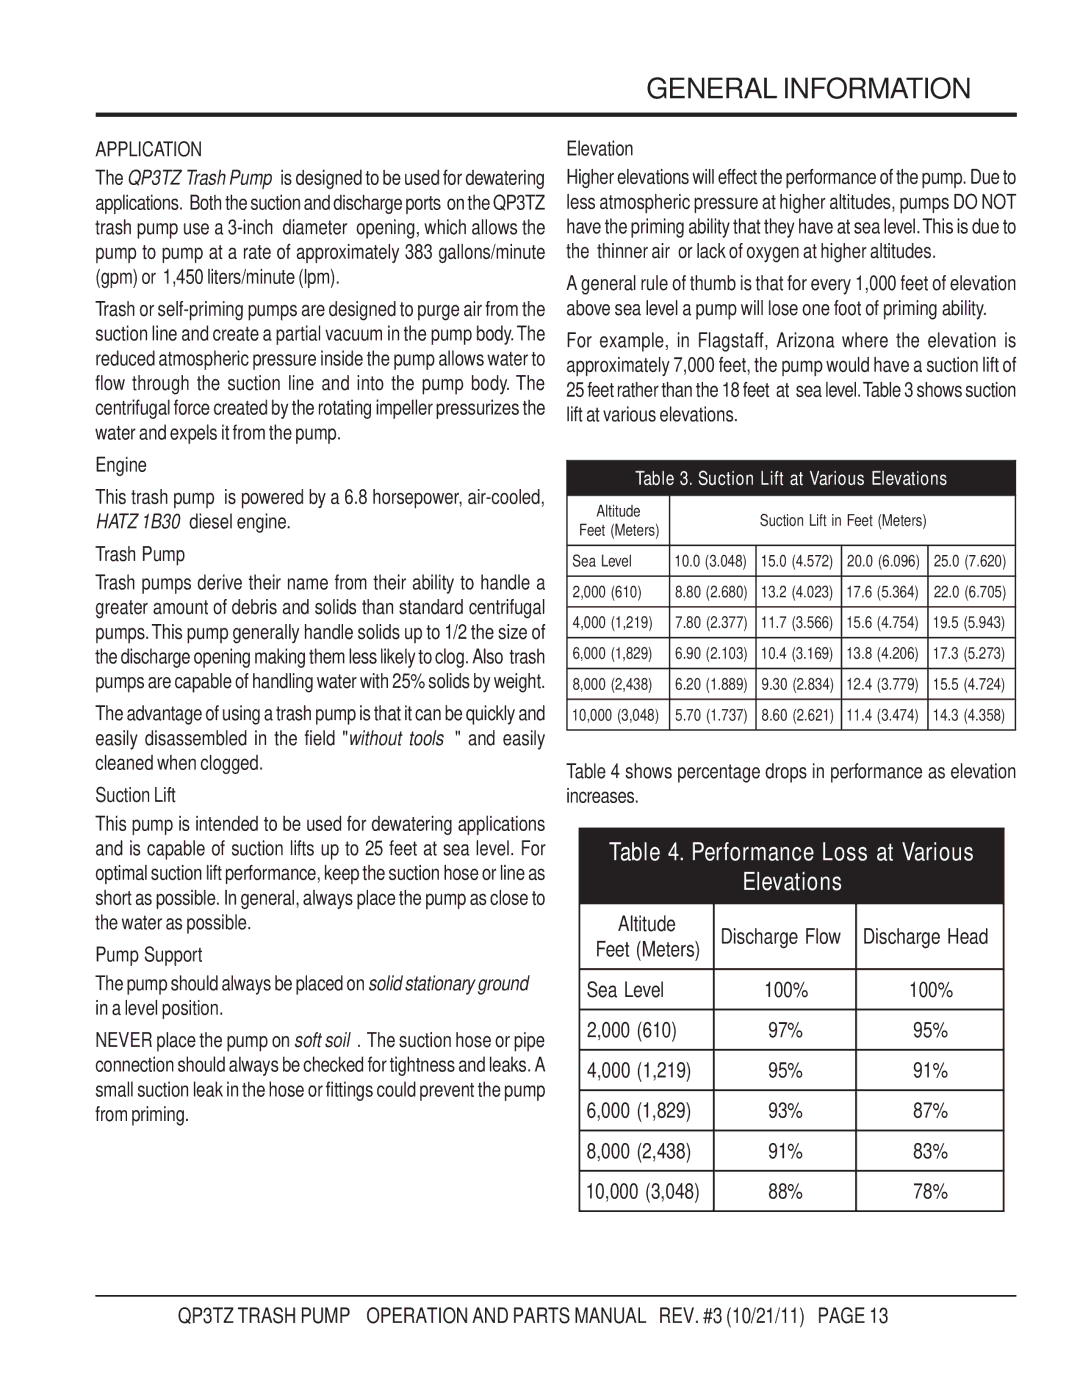
Higher elevations will effect the performance of the pump. Due to less atmospheric pressure at higher altitudes, pumps DO NOT have the priming ability that they have at sea level.This is due to the “thinner air” or lack of oxygen at higher altitudes.
A general rule of thumb is that for every 1,000 feet of elevation above sea level a pump will lose one foot of priming ability.
For example, in Flagstaff, Arizona where the elevation is approximately 7,000 feet, the pump would have a suction lift of 25 feet rather than the 18 feet at sea level.Table 3 shows suction lift at various elevations.
Table 3. Suction Lift at Various Elevations
Altitude |
|
| Suction Lift in Feet (Meters) |
|
| |||
Feet (Meters) |
|
|
|
| ||||
|
|
|
|
|
|
|
| |
|
|
|
|
|
| |||
Sea Level | 10.0 (3.048) | 15.0 | (4.572) | 20.0 (6.096) | 25.0 (7.620) | |||
|
|
|
|
|
|
|
| |
2,000 (610) | 8.80 | (2.680) | 13.2 | (4.023) | 17.6 | (5.364) | 22.0 (6.705) | |
|
|
|
|
|
|
|
|
|
4,000 (1,219) | 7.80 | (2.377) | 11.7 | (3.566) | 15.6 | (4.754) | 19.5 | (5.943) |
|
|
|
|
|
|
|
|
|
6,000 (1,829) | 6.90 | (2.103) | 10.4 | (3.169) | 13.8 | (4.206) | 17.3 | (5.273) |
|
|
|
|
|
|
|
| |
8,000 (2,438) | 6.20 | (1.889) | 9.30 (2.834) | 12.4 | (3.779) | 15.5 | (4.724) | |
|
|
|
|
|
|
|
| |
10,000 (3,048) | 5.70 | (1.737) | 8.60 (2.621) | 11.4 | (3.474) | 14.3 | (4.358) | |
|
|
|
|
|
|
|
|
|
Table 4 shows percentage drops in performance as elevation increases.
Table 4. Performance Loss at Various
Elevations
Altitude | Discharge Flow | Discharge Head |
Feet (Meters) | ||
|
|
|
Sea Level | 100% | 100% |
|
|
|
2,000 (610) | 97% | 95% |
|
|
|
4,000 (1,219) | 95% | 91% |
|
|
|
6,000 (1,829) | 93% | 87% |
|
|
|
8,000 (2,438) | 91% | 83% |
|
|
|
10,000 (3,048) | 88% | 78% |
|
|
|
