10153-01
Trademarks
Europe EU Declaration of Conformity
10153-01
World Wide Web
10153-01
Contents
Chapter Wireless Configuration
Chapter Troubleshooting
Appendix C Preparing Your Network
Glossary
Xii Contents
Chapter About This Manual
Audience, Scope, Conventions, and Formats
How to Use This Manual
Html version of this manual
How to Print this Manual
About This Manual
Key Features of the Router
Chapter Introduction
802.11g Wireless Networking
Powerful, True Firewall with Content Filtering
Autosensing Ethernet Connections with Auto Uplink
Security
Extensive Protocol Support
Easy Installation and Management
Package Contents
Router’s Front Panel
LED Descriptions
Router’s Rear Panel
WGT624 Rear Panel
Introduction
Chapter Connecting the Router to the Internet
Computer Network Configuration Requirements
What You Will Need Before You Begin
Cabling and Computer Hardware Requirements
Internet Configuration Requirements
Where Do I Get the Internet Configuration Parameters?
Record Your Internet Connection Information
Connecting the Router
Connecting the WGT624
Connect the wireless router to your network
Router
Log in to the wireless router
Log in to the router
Login window
Connect to the Internet
Connecting the Router to the Internet
Setup Smart Wizard menu for PPPoE accounts
PPPoE Smart Wizard-Detected Option
Setup Smart Wizard menu for Telstra Bigpond Cable accounts
Telstra Bigpond Cable Smart Wizard-Detected Option
Dynamic IP Smart Wizard-Detected Option
Fixed IP Account Smart Wizard-Detected Option
10 Setup Smart Wizard menu for Fixed IP address accounts
How to Manually Configure Your Internet Connection
ISP Does Not Require Login ISP Does Require Login
Connecting the Router to the Internet
12 Basic Settings ISP list
Connecting the Router to the Internet
Chapter Wireless Configuration
Observe Performance, Placement, and Range Guidelines
Implement Appropriate Wireless Security
WGT624
Understanding Wireless Settings
Wireless Settings menu
Wireless Configuration
Understanding WEP Authentication and Encryption
Authentication Scheme Selection
Default Factory Settings
Encryption Strength Choices
Before You Change the Ssid and WEP Settings
How to Set Up and Test Basic Wireless Connectivity
How to Restrict Wireless Access by MAC Address
Wireless Card Access List Setup
How to Configure WEP
Wireless Settings encryption menu
Wireless Configuration
Chapter Content Filtering
Blocking Access to Internet Sites
Blocking Access to Internet Services
Block Services menu
Configuring a User Defined Service
Add Services menu
Scheduling When Blocking Will Be Enforced
Configuring Services Blocking by IP Address Range
Viewing Logs of Web Access or Attempted Web Access
Logs menu
Log entries are described in Table
Configuring E-Mail Alert and Web Access Log Notifications
Email menu
Content Filtering
Chapter Maintenance
Viewing Router Status Information
This screen shows the following parameters
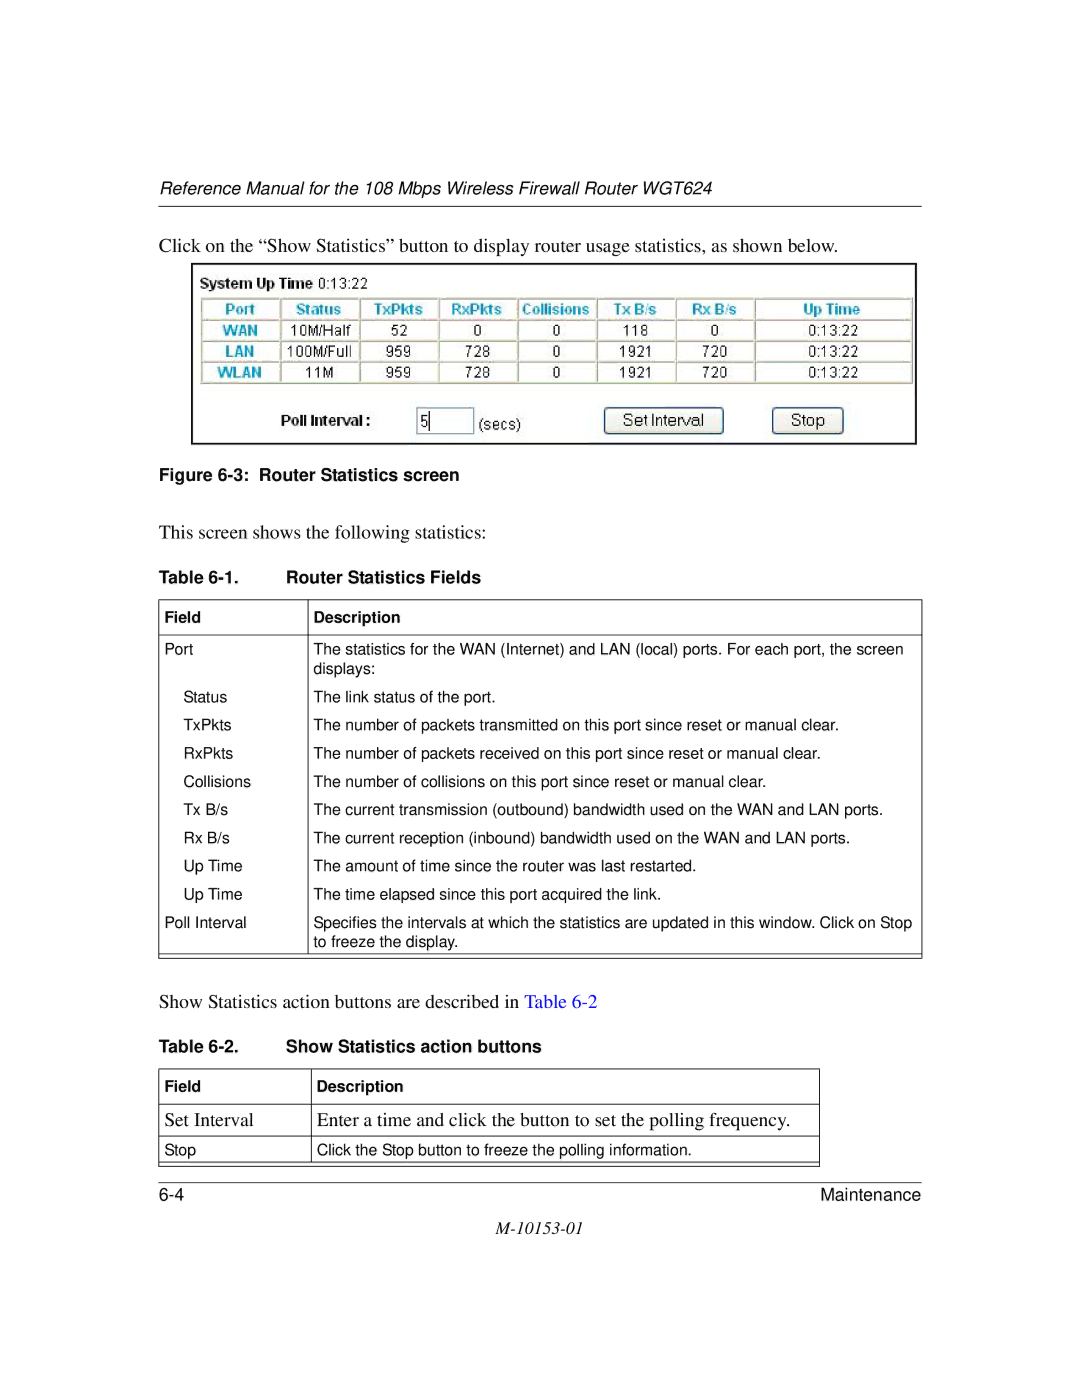
This screen shows the following statistics
Renew Click the Renew button to renew the Dhcp lease
Show Statistics action buttons are described in Table
Viewing a List of Attached Devices
Upgrading the Router Software
Configuration File Management
Router Upgrade menu
Restoring and Backing Up the Configuration
Settings Backup menu
Changing the Administrator Password
Erasing the Configuration
Chapter Advanced Configuration
Configuring Port Forwarding to Local Servers
Adding a Port Forwarding Custom Service
Editing or Deleting a Port Forwarding Entry
Local Web and FTP Server Example
Multiple Computers for Half Life, Kali or Quake III Example
Configuring WAN Setup Options
Disable SPI Firewall
Setting Up a Default DMZ Server
Connect Automatically, as Required
Setting the MTU Size
Respond to Ping on Internet WAN Port
Using a Dynamic DNS Service
Using LAN IP Setup Options
LAN IP Setup Menu
Using the Router as a Dhcp server
Using Address Reservation
How to Configure Static Routes
To add or edit a Static Route
Click the Add button to open the Add/Edit Menu, shown below
Enabling Remote Management Access
Using Universal Plug and Play UPnP
Advanced Configuration
Power LED Not On
Chapter Troubleshooting
Basic Functioning
LEDs Never Turn Off
Local or Internet Port LEDs Not On
Troubleshooting the Web Configuration Interface
Troubleshooting the ISP Connection
Troubleshooting a TCP/IP Network Using a Ping Utility
Testing the LAN Path to Your Router
Testing the Path from Your PC to a Remote Device
Restoring the Default Configuration and Password
Problems with Date and Time
10153-01
Appendix a Technical Specifications
TCP/IP, RIP-1, RIP-2, Dhcp
Wireless
Appendix B Network, Routing, Firewall, and Basics
What is a Router?
Related Publications Basic Router Concepts
IP Addresses and the Internet
Routing Information Protocol
Class E Class E addresses are for experimental use
Netmask
Subnet Addressing
Example of Subnetting a Class B Address
Netmask Notation Translation Table for One Octet
Single IP Address Operation Using NAT
Private IP Addresses
MAC Addresses and Address Resolution Protocol
Following figure illustrates a single IP address operation
Related Documents
Domain Name Server
What is a Firewall?
IP Configuration by Dhcp
Internet Security and Firewalls
Ethernet Cabling
Stateful Packet Inspection
Category 5 Cable Quality
Inside Twisted Pair Cables
Figure B-2illustrates crossover twisted pair cable
Uplink Switches, Crossover Cables, and MDI/MDIX Switching
Appendix C Preparing Your Network
Preparing Your Computers for TCP/IP Networking
Configuring Windows 95, 98, and Me for TCP/IP Networking
Install or Verify Windows Networking Components
Preparing Your Network
Enabling Dhcp to Automatically Configure TCP/IP Settings
Choose Settings, and then Control Panel
Primary Network Logon is set to Windows logon
Selecting Windows’ Internet Access Method
Verifying TCP/IP Properties
Configuring Windows NT4, 2000 or XP for IP Networking
Dhcp Configuration of TCP/IP in Windows XP
Dhcp Configuration of TCP/IP in Windows XP, 2000, or NT4
Locate your Network Neighborhood icon
Preparing Your Network
Dhcp Configuration of TCP/IP in Windows
Preparing Your Network
Obtain an IP address automatically is selected
Dhcp Configuration of TCP/IP in Windows NT4
Preparing Your Network
Verifying TCP/IP Properties for Windows XP, 2000, and NT4
TCP/IP Properties dialog box now displays
MacOS 8.6 or
Configuring the Macintosh for TCP/IP Networking
MacOS
Verifying TCP/IP Properties for Macintosh Computers
What Is Your Configuration Information?
Are Login Protocols Used?
Verifying the Readiness of Your Internet Account
Select the Gateway tab
Preparing Your Network
Restarting the Network
Preparing Your Network
Wireless Networking Overview
Appendix D Wireless Networking Basics
Infrastructure Mode
Ad Hoc Mode Peer-to-Peer Workgroup
Network Name Extended Service Set Identification Essid
Authentication and WEP
Authentication
Open System Authentication Steps
Shared Key Authentication Steps
Key Size
Wireless Channels
WEP Configuration Options
Radio frequency channels used are listed in Table
Glossary
List of Glossary Terms
Adsl
CRL
Encapsulating Security Payload
Internet service provider
Megabits per second
NAT
Public Switched Telephone Network
Ssid
UTP
Wins
Glossary
Index
Numerics
Ietf B-1
RFC
Index