Among overweight people, it is excess fat and not weight alone that carries health risks. Since the body comprises elements of varying densities, weight or BMI cannot fully measure exactly how much excess fat a person carries. For example, two people of the same weight and BMI may have big differences in body composition. One may carry excess fat while the other carry acceptable level of fat needed to regulate the body. As such, a Body Fat Percentage measurement is an effective assessment of your current health level.
![]() Essential fat is necessary for bodily functions, since it helps to maintain body temperature an insulate organs and tissues.
Essential fat is necessary for bodily functions, since it helps to maintain body temperature an insulate organs and tissues.
How Body Fat is Measured
How to Interpret Body Fat Percentage
Use the resulting Body Fat Percentage value with the chart below to determine your current level of health:
ADULT MEN |
|
|
| ||
|
|
|
|
| |
Body | Age Group in Years | ||||
Fat |
|
|
|
| |
< 30 | 30- | 40- | > 49 | ||
Level | |||||
| 39 | 49 |
| ||
Very | > | > | > | > | |
High | 28% | 29% | 30% | 31% | |
High | 22 - | 23 - | 24 - | 25 - | |
| 28% | 29% | 30% | 31% | |
Normal | 11 - | 12 - | 13 - | 14 - | |
| 21% | 22% | 23% | 24% | |
Low | 6 - | 7 - | 8 - | 9 - | |
| 10% | 11% | 12% | 13% | |
Very | <6% | <7% | <8% | <9% | |
Low |
|
|
|
| |
ADULT WOMEN |
|
|
| ||
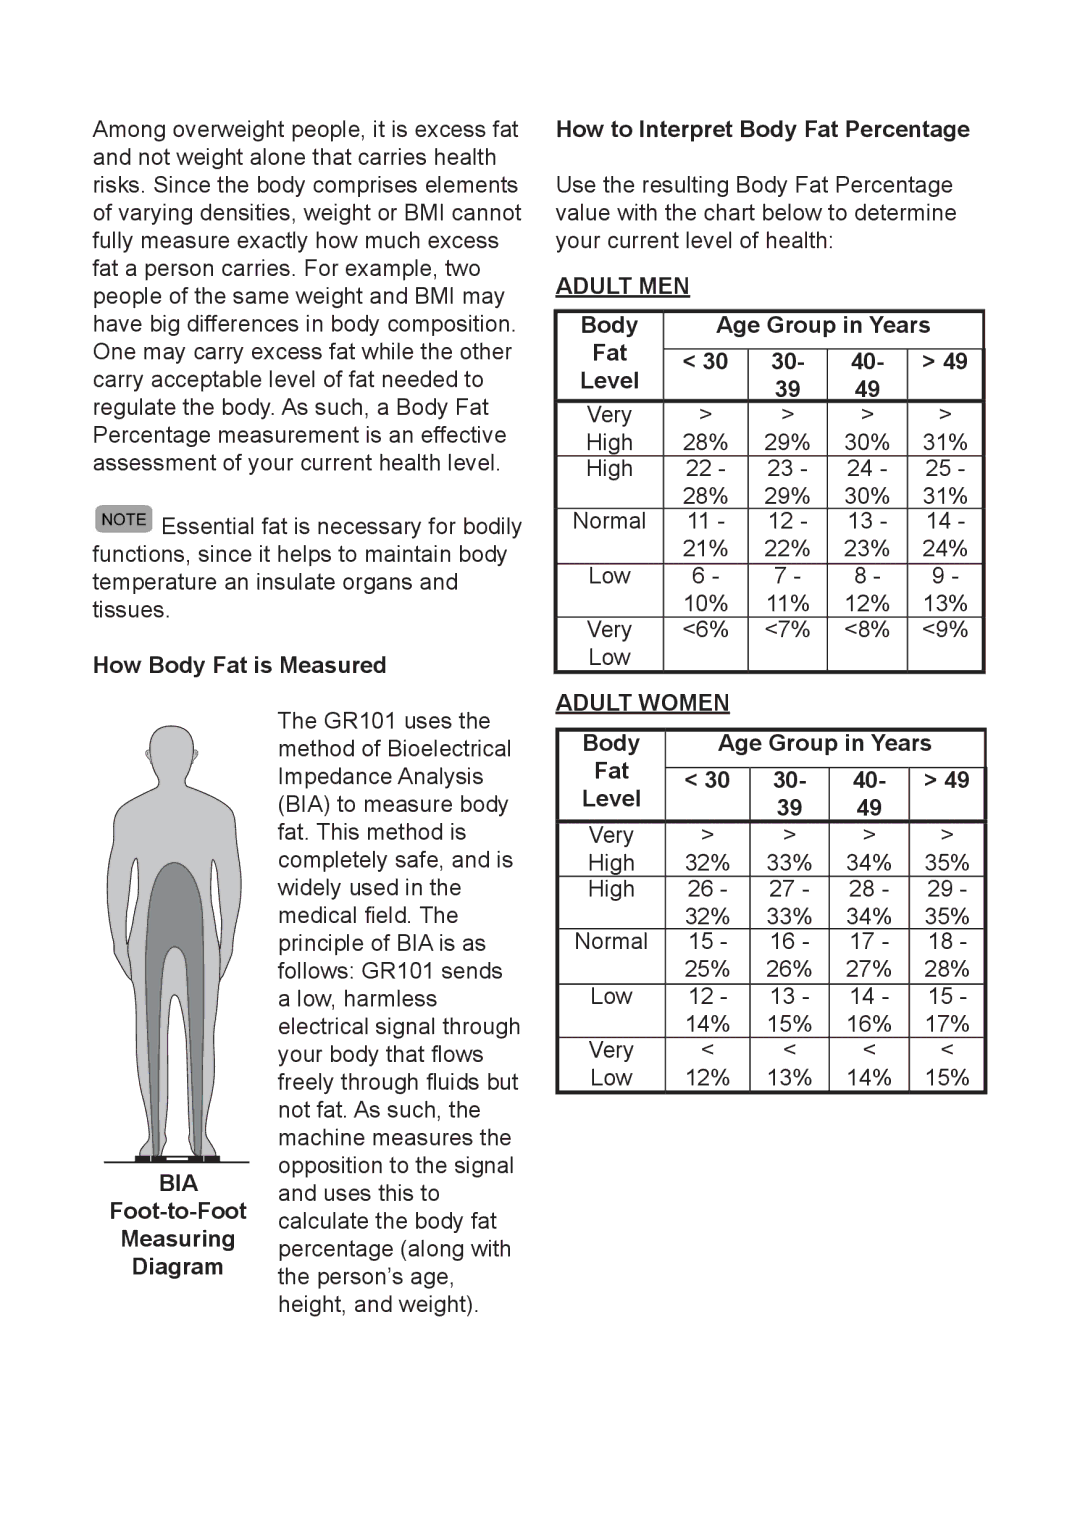
BIA
Foot-to-Foot
Measuring
Diagram
The GR101 uses the method of Bioelectrical Impedance Analysis (BIA) to measure body fat. This method is completely safe, and is widely used in the medical field. The principle of BIA is as follows: GR101 sends a low, harmless electrical signal through your body that flows freely through fluids but not fat. As such, the machine measures the opposition to the signal and uses this to calculate the body fat percentage (along with the person’s age, height, and weight).
Body | Age Group in Years | ||||
Fat |
|
|
|
| |
< 30 | 30- | 40- | > 49 | ||
Level | |||||
| 39 | 49 |
| ||
Very | > | > | > | > | |
High | 32% | 33% | 34% | 35% | |
High | 26 - | 27 - | 28 - | 29 - | |
| 32% | 33% | 34% | 35% | |
Normal | 15 - | 16 - | 17 - | 18 - | |
| 25% | 26% | 27% | 28% | |
Low | 12 - | 13 - | 14 - | 15 - | |
| 14% | 15% | 16% | 17% | |
Very | < | < | < | < | |
Low | 12% | 13% | 14% | 15% | |
