“ A N S ” K E Y S F O R 1 -V A R I A B L E S T AT I S T I C S
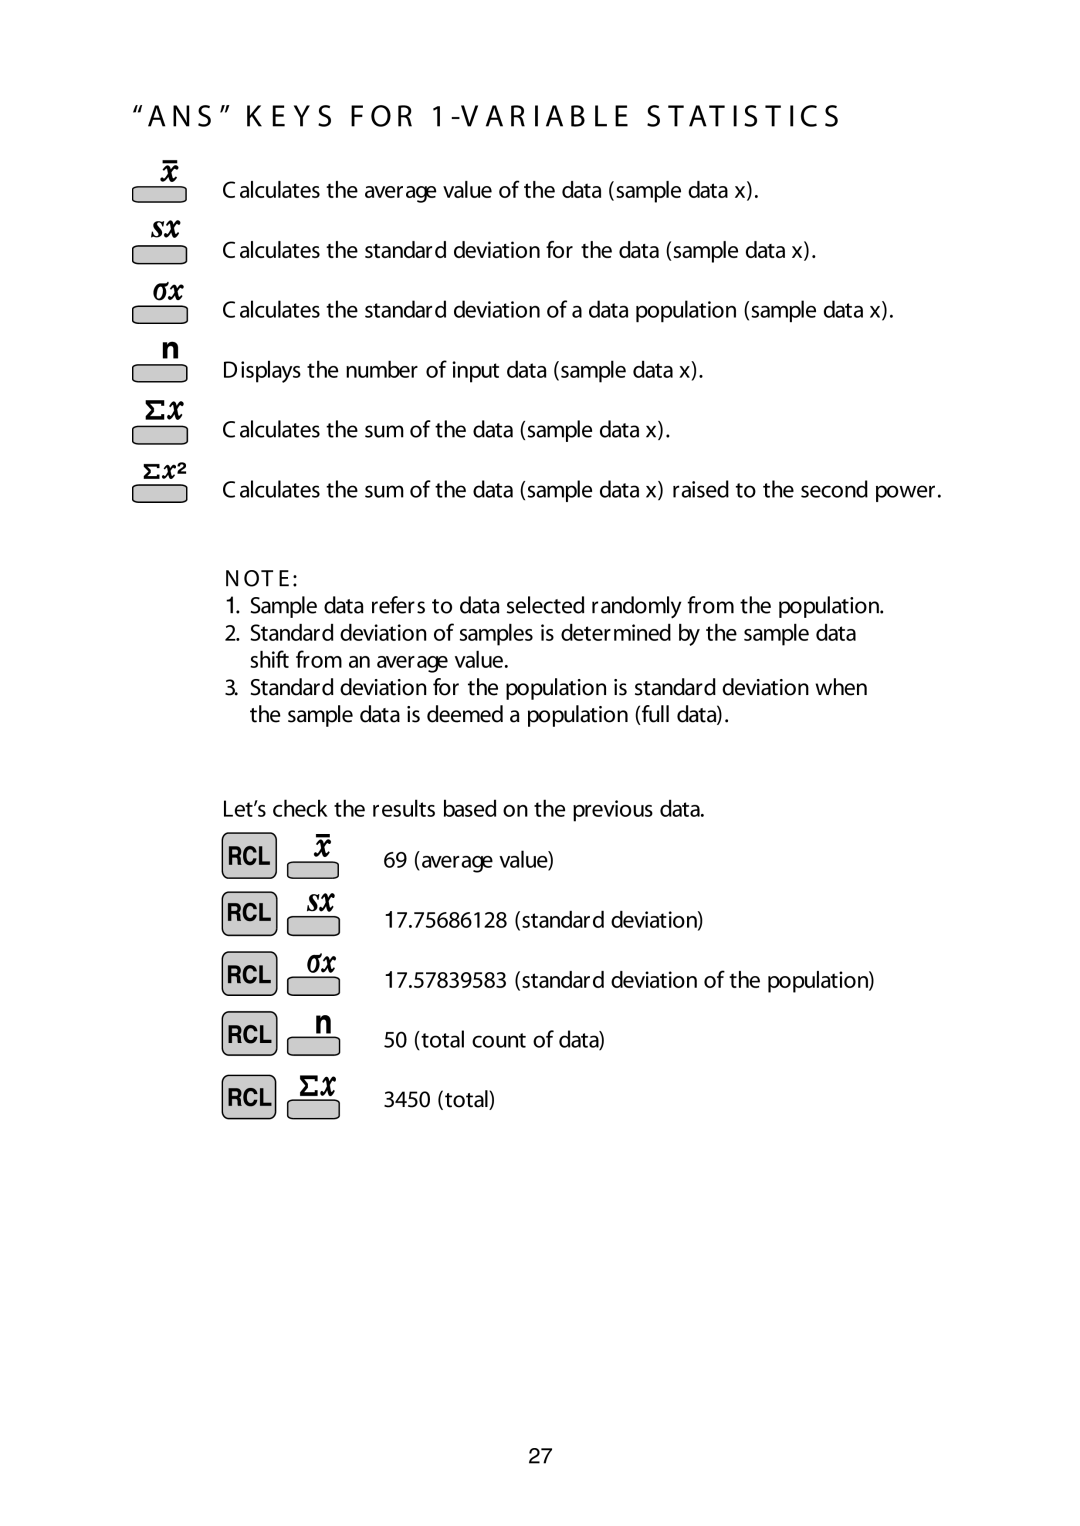
C alculates the average value of the data (sample data x).
C alculates the standard deviation for the data (sample data x).
C alculates the standard deviation of a data population (sample data x).
Displays the number of input data (sample data x).
C alculates the sum of the data (sample data x).
C alculates the sum of the data (sample data x) raised to the second power.
N OT E :
1. Sample data refers to data selected randomly from the population.
2.Standard deviation of samples is determined by the sample data shift from an average value.
3.Standard deviation for the population is standard deviation when the sample data is deemed a population (full data).
Let’s check the results based on the previous data.
69 (average value)
17.75686128 (standard deviation)
17.57839583 (standard deviation of the population)
50 (total count of data)
3450 (total)
27