Fig. 15:
Curve 1:
Curve 2:
PHASE
MEASUREMENTS
The following measurements show that the Optimizer´s phase response is very stable at high amplitudes.
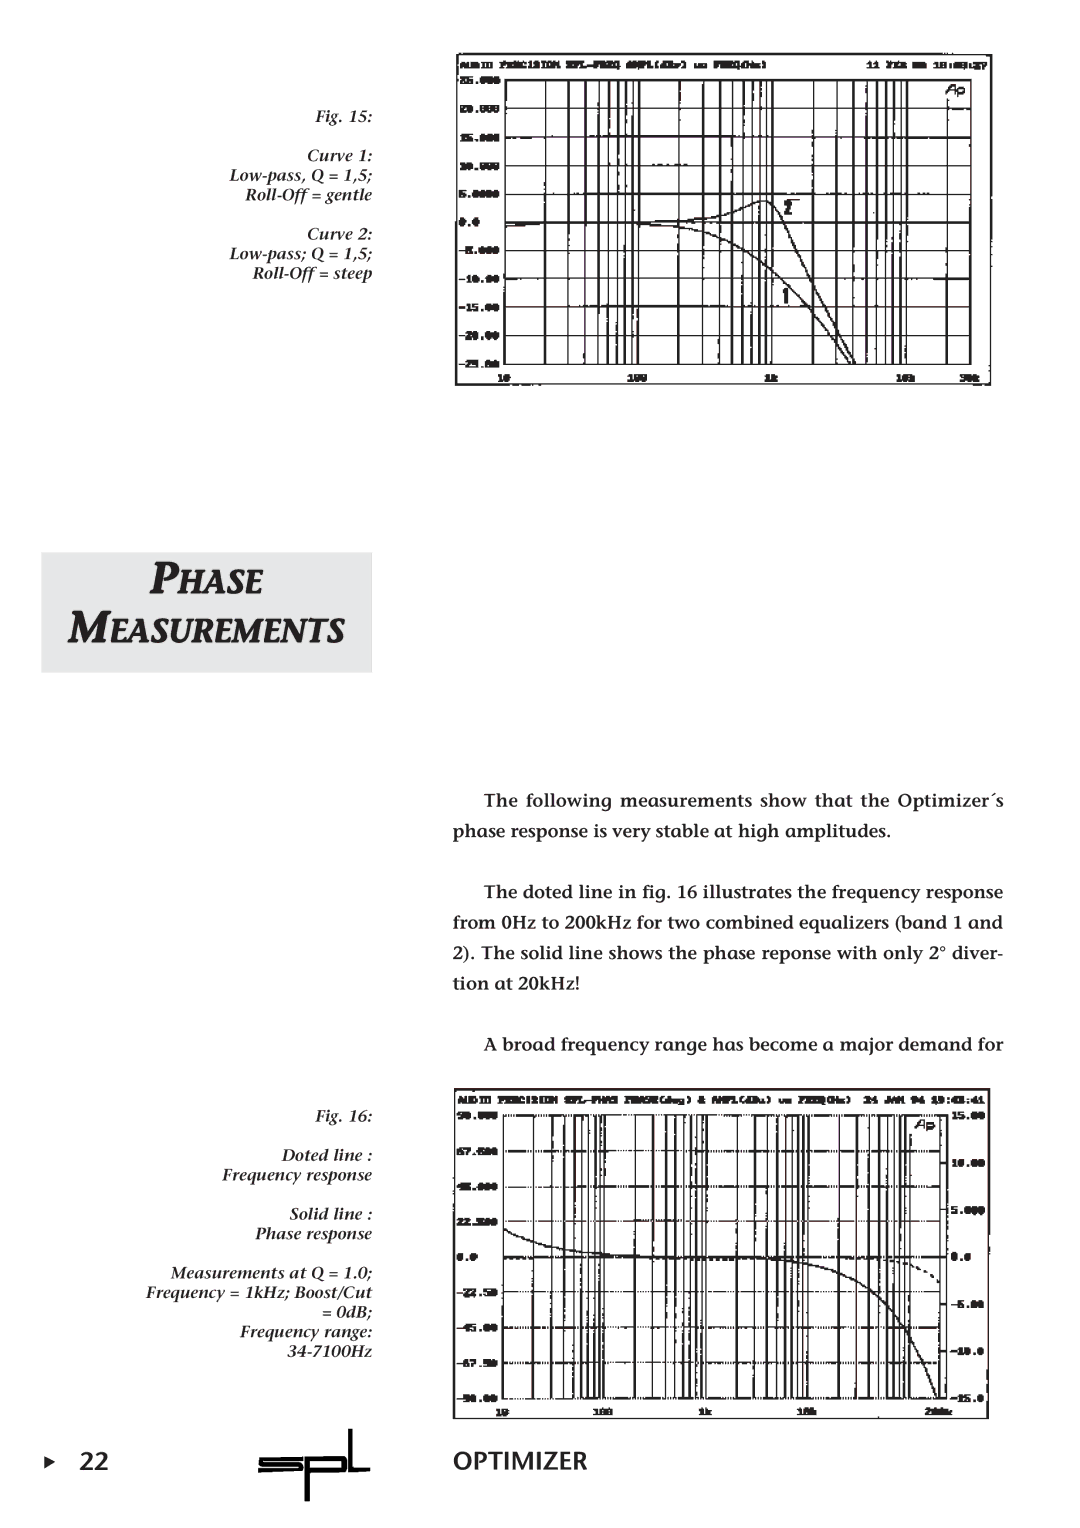
The doted line in fig. 16 illustrates the frequency response from 0Hz to 200kHz for two combined equalizers (band 1 and 2). The solid line shows the phase reponse with only 2° diver- tion at 20kHz!
A broad frequency range has become a major demand for
Fig. 16:
Doted line :
Frequency response
Solid line :
Phase response
Measurements at Q = 1.0;
Frequency = 1kHz; Boost/Cut
=0dB; Frequency range:
22 | OPTIMIZER |