Explanation of the Print Out |
|
|
|
|
|
|
|
|
|
| ||
|
|
| Sample |
|
|
|
|
| ||||
|
|
| T A N I T A |
|
|
|
|
| ||||
|
| B O D Y C O M P O S I T I O N |
|
|
|
|
| |||||
|
|
| A N A L Y Z E R |
|
|
|
|
| ||||
BMI:Body Mass Index is a height to weight |
|
| B C — 4 1 8 |
|
| BMR:Basal Metabolic Rate represents the | ||||||
ratio, and is calculated by the following | 2 1 ⁄ S E P ⁄ 2 0 0 2 | 1 9 : 2 9 |
|
| ||||||||
|
| total energy expended by the body to | ||||||||||
formula: |
|
| ||||||||||
Weight (kg) | B O D Y T Y P E |
|
| S T A N D A R D | maintain normal functions at rest such as | |||||||
|
| respiration and circulation. | ||||||||||
Height (m2) |
|
| ||||||||||
G E N D E R |
|
|
| M A L E |
|
|
| |||||
Desirable Range 18.5 - 24.9 |
|
|
|
|
|
| ||||||
A G E |
|
|
|
| 3 4 |
|
|
|
|
| ||
| H E I G H T |
|
|
| 1 7 9 |
| c m |
|
|
| ||
| W E I G H T |
|
|
| 7 3 . 3 k g | FAT MASS:Total weight of fat mass (in kg , | ||||||
FAT%:The percentage of total body weight | B M I |
|
|
|
| 2 3 . | 9 |
| ||||
|
|
|
|
| lb) in the body. |
| ||||||
B M R |
|
|
|
| 7 2 9 4 |
| k J |
| ||||
that is fat. |
|
|
|
|
|
|
|
| ||||
|
|
|
|
| 1 7 4 3 | k c a l |
|
|
| |||
|
|
|
|
|
|
|
|
| ||||
| F A T % |
|
|
| 1 3 . | 1 | % |
|
|
| ||
| F A T M A S S |
|
| 9 . 6 k g |
|
|
| |||||
FFM:Fat Free Mass is comprised of muscle, | F F M |
|
|
|
| 6 3 . | 7 | k g | TBW:Total Body Water is the amount of | |||
bone, tissue, water, and all other fat free | T B W |
|
|
|
| 4 6 . | 6 | k g | ||||
|
|
|
| water (expressed as lb, kg, or st.lb) retained | ||||||||
mass in the body. | D E S I R A B L E R A N G E |
|
|
| ||||||||
8 – 2 0 | % | in the body. TBW is said to comprise | ||||||||||
| F A T % |
|
|
| ||||||||
|
|
|
| between 50% - 70% of total body weight. | ||||||||
| F A T M A S S |
|
| 5 . 5 – 1 5 . | 9 | k g | ||||||
|
|
|
|
|
|
|
|
| Generally, men tend to have higher water | |||
| T A R G E T | B F % | i s | : |
|
|
| weight than women due to a greater | ||||
PW:Predicted weight |
| 2 0 % | amount of muscle. |
| ||||||||
Calculated weight for the given Target | P r e d i c t e d | w e i g h t | : |
|
|
|
| |||||
BF%. | 7 9 . | 6 | k g |
|
|
| ||||||
|
|
|
|
|
|
|
|
| ||||
| P r e d i c t e d f a t | m a s s : |
|
|
|
|
| |||||
| F A T | T O G A I N : |
|
| 1 5 . | 9 | k g | PFM:Predicted fat mass | ||||
|
|
| 6 . | 3 | k g | Caluculated fat mass for the given Target | ||||||
FAT TO LOSE/GAIN: |
|
|
|
|
| BF%. |
| |||||
C o n s u l t y o u r p h y s i c i a n |
|
|
|
|
| |||||||
Calculated fat mass to lose or gain to |
|
|
|
|
| |||||||
b e f o r e b e g i n n i n g | a n y |
|
|
|
|
| ||||||
achieve the Predicted Weight. | w e i g h t m a n a g e m e n t p r o – |
|
|
|
|
| ||||||
g r a m . T a n i t a | i s | n o t r e – |
|
|
|
|
| |||||
| s p o n s i b l e f o r d e t e r – |
|
|
|
|
| ||||||
| m i n i n g y o u r t a r g e t B F % . |
|
|
|
|
| ||||||
|
|
|
|
|
|
|
|
| S e g m e n t a l A n a l y s i s |
| ||
| I M P E D A N C E |
|
|
|
|
| R i g h t L e g |
|
| |||
| W h o l e B o d y |
|
| 5 5 1 |
| Ω | F a t % | 8 . 9 % | ||||
IMPEDANCE:Impedance reflects the body’s | R i g h t | L e g |
|
|
| 2 1 2 |
| Ω | F a t M a s s | 1 . 1 | k g | |
inherent resistance to an electrical current. | L e f t | L e g |
|
|
| 2 1 4 |
| Ω | F F M | 1 1 . 5 | k g | |
Muscle acts as a conductor of the electrical | R i g h t | A r m |
|
| 2 9 2 |
| Ω | P r e d i c t e d | M u s c l e M a s s |
| ||
current, adipose tissue acts as a resistor. | L e f t A r m |
|
|
| 3 0 9 |
| Ω | L e f t L e g | 1 0 . 9 k g | |||
|
|
|
|
|
|
|
|
|
| |||
|
|
|
|
|
|
|
|
|
|
| ||
|
|
|
|
|
|
|
|
| F a t % | 1 0 . 1 | % | |
|
|
|
|
|
|
|
|
| F a t M a s s | 1 . 2 k g | ||
| PMS:Predicted Muscle Mass |
|
|
|
|
| F F M | 1 1 . 0 | k g | |||
|
|
|
|
|
| P r e d i c t e d M u s c l e M a s s |
| |||||
| means |
|
| R i g h t A r m | 1 0 . 4 | k g | ||||||
|
|
|
|
|
|
|
|
|
|
| ||
|
|
|
|
|
|
|
|
| F a t % | 1 4 . 0 | % | |
|
|
|
|
|
|
|
|
| F a t M a s s | 0 . 6 k g | ||
|
|
|
|
|
|
|
|
| F F M | 3 . 6 | k g | |
|
|
|
|
|
|
|
|
| P r e d i c t e d M u s c l e M a s s |
| ||
|
|
|
|
|
|
|
|
| L e f t A r m | 3 . 4 | k g | |
|
|
|
|
|
|
|
|
|
|
| ||
|
|
|
|
|
|
|
|
| F a t % | 1 5 . 4 | % | |
|
|
|
|
|
|
|
|
| F a t M a s s | 0 . 6 k g | ||
|
|
|
|
|
|
|
|
| F F M | 3 . 5 | k g | |
|
|
|
|
|
|
|
|
| P r e d i c t e d M u s c l e M a s s |
| ||
|
|
|
|
|
|
|
|
| T r u n k | 3 . 3 | k g | |
|
|
|
|
|
|
|
|
|
|
| ||
|
|
|
|
|
|
|
|
| F a t % | 1 5 . 0 | % | |
|
|
|
|
|
|
|
|
| F a t M a s s | 6 . 0 k g | ||
|
|
|
|
|
|
|
|
| F F M | 3 4 . 1 | k g | |
|
|
|
|
|
|
|
|
| P r e d i c t e d M u s c l e M a s s |
| ||
|
|
|
|
|
|
|
|
|
| 3 2 . 8 | k g | |
NOTE:Please refer to the Technical Notes for details.
Please consult your doctor before you start a body weight management program. Tanita is not responsible for the target body fat ratio.
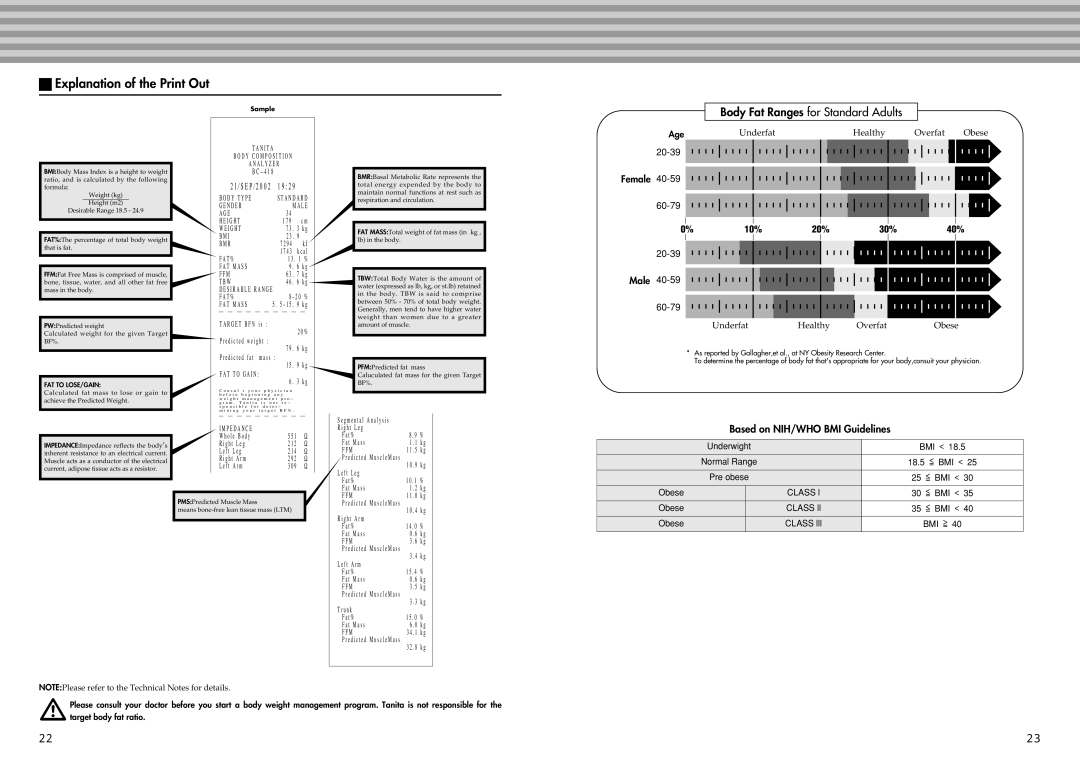
Body Fat Ranges for Standard Adults
Age | Underfat | Healthy | Overfat | Obese |
Female ![]()
![]()
![]()
![]()
![]()
![]()
![]()
![]()
![]()
![]()
![]()
![]()
![]()
![]()
![]()
![]()
![]()
0% | 10% | 20% | 30% | 40% |
20-39
Male 40-59 


60-79
Underfat | Healthy | Overfat | Obese |
*As reported by Gallagher,et al., at NY Obesity Research Center.
To determine the percentage of body fat that's appropriate for your body,consuit your physician.
Based on NIH/WHO BMI Guidelines
Underwight |
| BMI < 18.5 | |
Normal Range |
| 18.5 ≦ BMI < 25 | |
Pre obese |
| 25 ≦ BMI < 30 | |
Obese |
| CLASS l | 30 ≦ BMI < 35 |
Obese |
| CLASS ll | 35 ≦ BMI < 40 |
Obese |
| CLASS lll | BMI ≧ 40 |
|
|
|
|
22 | 23 |