Analyze
Complex RF Signals
The analysis capabilities of the
By acquiring a record of
It provides an intuitive,
In addition to providing
Completely 


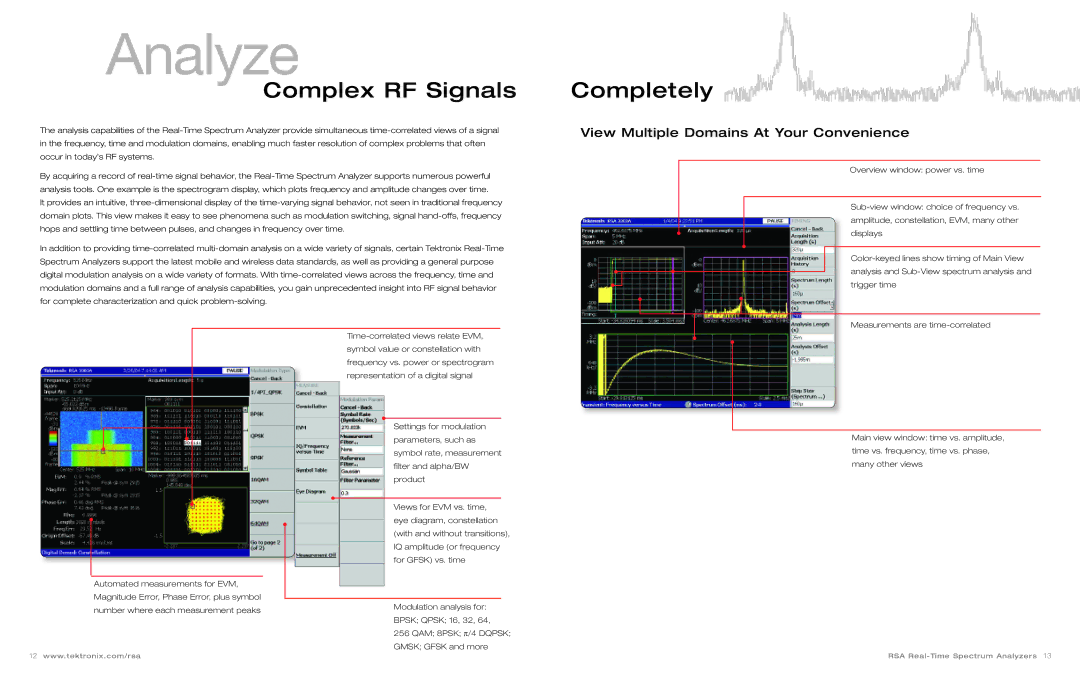
View Multiple Domains At Your Convenience
Overview window: power vs. time
Measurements are
Automated measurements for EVM, Magnitude Error, Phase Error, plus symbol number where each measurement peaks
12www.tektronix.com/rsa
Settings for modulation parameters, such as symbol rate, measurement filter and alpha/BW product
Views for EVM vs. time, eye diagram, constellation (with and without transitions), IQ amplitude (or frequency for GFSK) vs. time
Modulation analysis for:
BPSK; QPSK; 16, 32, 64,
256 QAM; 8PSK; π/4 DQPSK; GMSK; GFSK and more
Main view window: time vs. amplitude, time vs. frequency, time vs. phase, many other views