#02036WB, 02037W, 02036WB specifications
The Acu-Rite 02036WB and 02037W are innovative weather stations that provide accurate and comprehensive weather information for home users. Designed for ease of use and reliability, these models incorporate advanced technologies that enable users to make informed decisions based on current weather conditions.One of the standout features of the Acu-Rite 02036WB is its ability to transmit data wirelessly from the outdoor sensor to the indoor display unit. This allows for real-time updates on temperature, humidity, wind speed, and precipitation levels. The wireless range typically extends up to 330 feet, making it convenient for placement around the home or in the backyard.
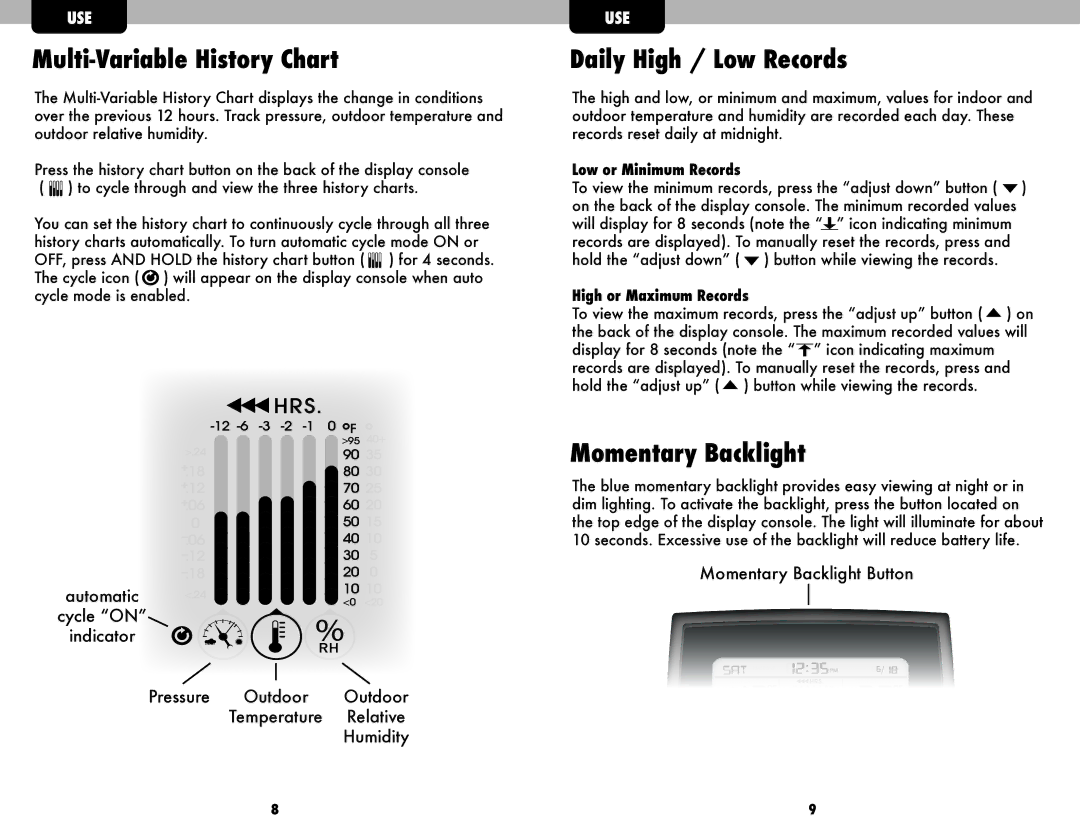
The 02036WB and 02037W also come equipped with a high-definition color display, which enhances visibility and readability. Users can easily view critical weather information at a glance, including the current temperature, barometric pressure, and weather forecasts. The touchscreen interface makes navigation straightforward, allowing users to customize settings and access historical data.
Another significant characteristic is the integration of self-calibrating technology. This feature allows the station to adjust to local atmospheric conditions automatically, delivering more precise measurements over time. Furthermore, both models support additional sensors, including rain gauges and anemometers, enabling users to expand their weather monitoring capabilities.
Acu-Rite's proprietary Community Internet Weather Network is another highlight. This feature allows users to share their weather data with a wider community, contributing to a larger pool of localized weather information. The shared data can enhance community awareness and preparedness for weather-related events.
In terms of durability, both the 02036WB and 02037W are built to withstand various weather conditions. The outdoor sensors are weather-resistant, ensuring longevity and consistent performance. With a user-friendly design and robust construction, these weather stations cater to both amateur meteorologists and casual users alike.
Overall, the Acu-Rite 02036WB and 02037W provide a perfect blend of cutting-edge technology and user-friendly features, making them essential tools for anyone interested in monitoring local weather patterns effectively. Whether for gardening, outdoor events, or simply staying informed, these weather stations deliver reliable, accurate data to enhance daily life.

