Manuals
/
Graco
/
Household Appliance
/
Heat Pump
Graco
3A2578B Performance Charts, Bolt-throughDiaphragms, Fluid Pressure, Air Consumption
Models:
3A2578B
1
20
24
24
Download
24 pages
23.8 Kb
17
18
19
20
21
22
23
24
Install
Performance Charts
Dimension
Maintenance
Pressure Relief Procedure
Weight
How to
To Order Replacement Parts
Technical Data
Page 20
Image 20
Page 19
Page 21
Page 20
Image 20
Page 19
Page 21
Contents
3A2578B
Husky 2200 Air-OperatedDiaphragm Pump
Operation
Contents
3A2578B
Warnings
Warnings
FIRE AND EXPLOSION HAZARD
PRESSURIZED EQUIPMENT HAZARD
PLASTIC PARTS CLEANING SOLVENT HAZARD
Warnings
EQUIPMENT MISUSE HAZARD
THERMAL EXPANSION HAZARD
Warnings
TOXIC FLUID OR FUMES HAZARD
BURN HAZARD
PERSONAL PROTECTIVE EQUIPMENT
To Order Replacement Parts
Ordering Information
Related Manuals
To Find Your Nearest Distributor
Configuration Number Matrix
2200P
P01A
2200P
Installation
General Information
Tighten Fasteners
Tips to Reduce Cavitation
Installation
Accessories/Components Not Supplied
System Components
3A2578B
Installation
Ground The System
Air Lines
•Fluid supply container: Follow local code
Air Exhaust Ventilation
NOTICE
Installation
To provide a remote exhaust
Fluid Supply Line
Fluid Outlet Line
Installation
3A2578B
3A2578B
Flange Connections
Installation
Pressure Relief Procedure
Start and Adjust the Pump
Operation
Flush the Pump Before First Use
Maintenance
Maintenance Schedule
Lubrication
Tighten Threaded Connections
Torque Instructions
Torque Instructions
Do not overtorque
Fluid Cover Screws
3A2578B
Notes
Notes
Dimensions
End Flange Models, Polypropylene and PVDF
Dimensions
Polypropylene
Center Flange Models, Polypropylene Only
Dimensions
Polypropylene
Polypropylene
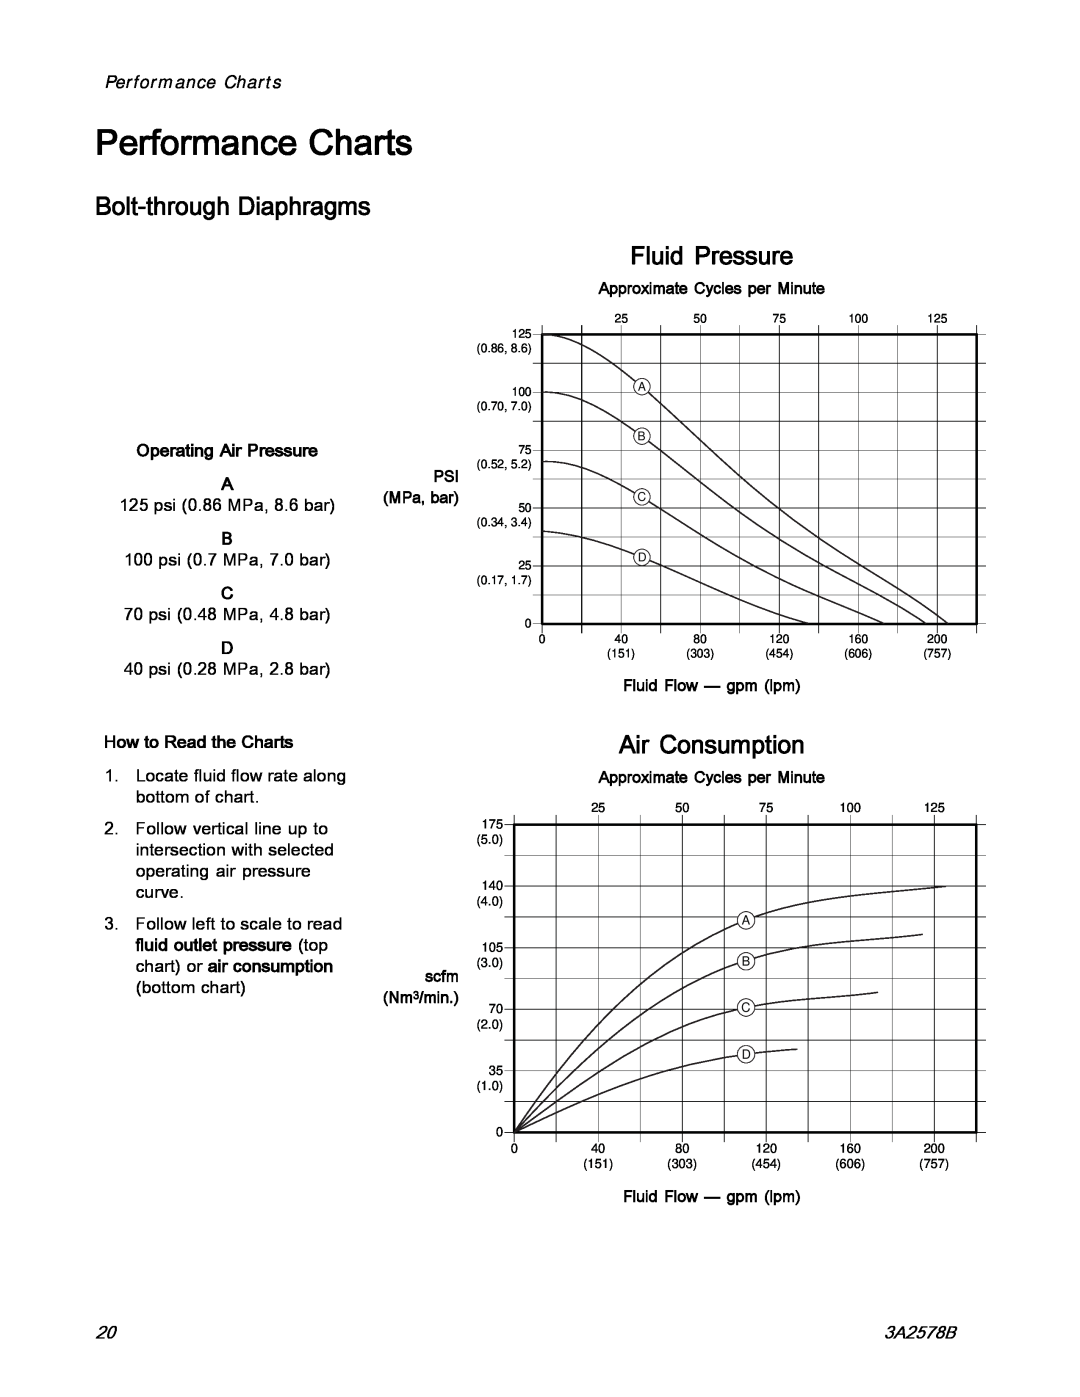
Performance Charts
Bolt-throughDiaphragms
Fluid Pressure
Air Consumption
Overmolded Diaphragms
Performance Charts
How to Read the Charts
Fluid Pressure
Technical Data
Technical Data
Husky 2200 Diaphragm Pump
Air consumption
Technical Data
Weight
Maximum pump speed
Wetted Parts
Graco Information
Graco Standard Husky Pump Warranty
Top
Page
Image
Contents