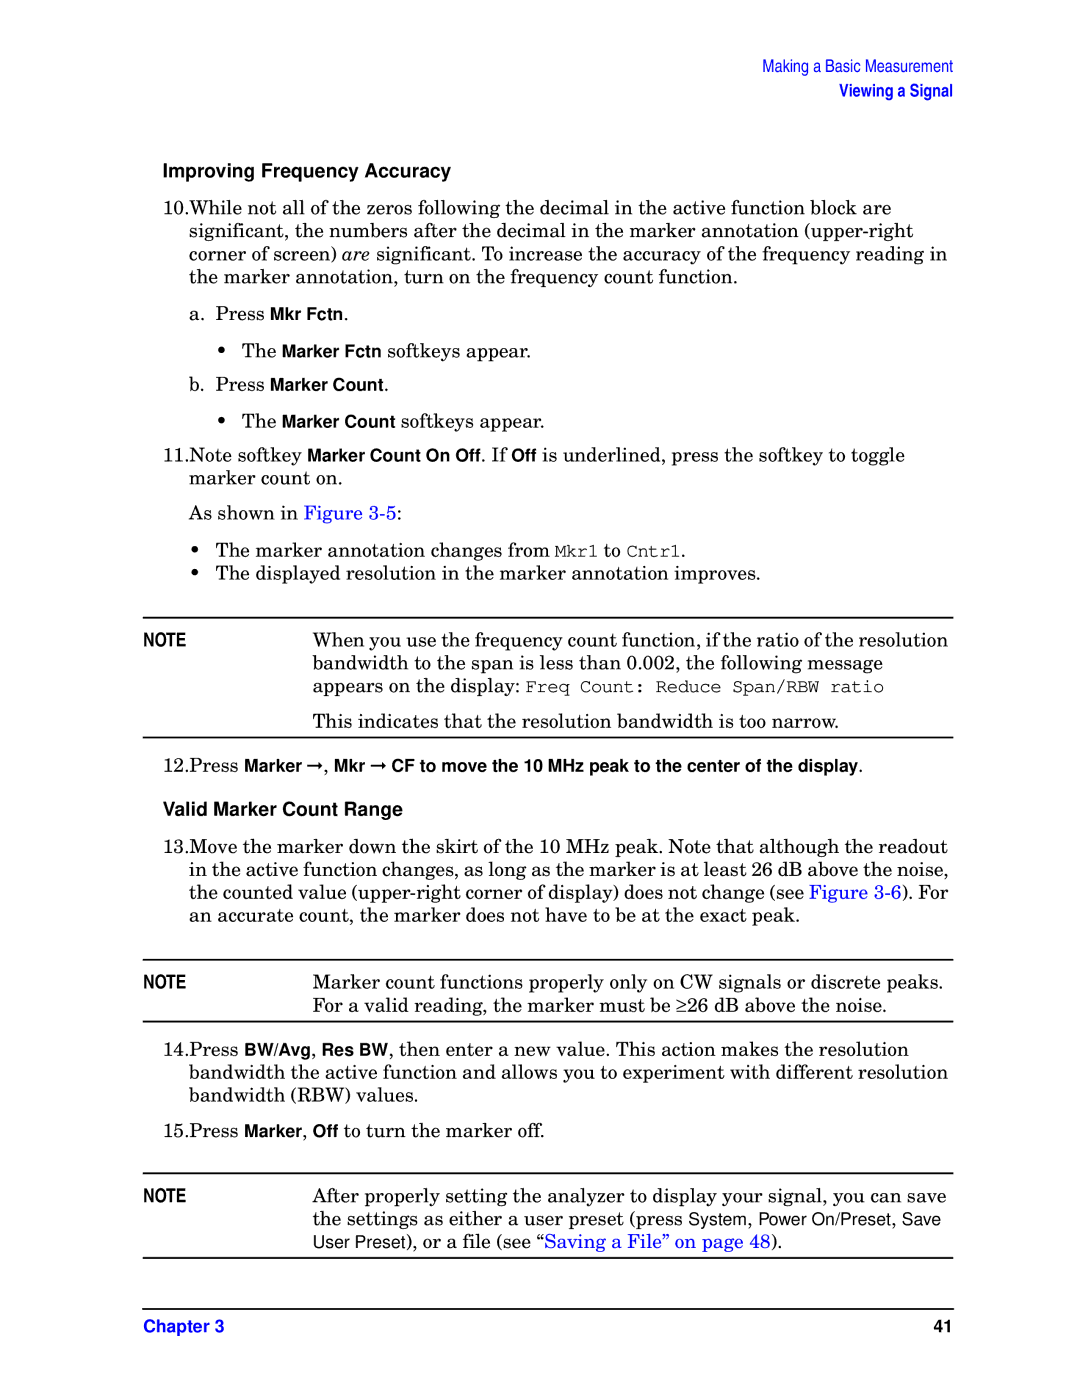
E4443A, E4448A, E4445A, E4446A, E4440A specifications
The HP E4440A, E4446A, E4445A, E4448A, and E4443A are high-performance spectrum analyzers designed to meet the testing and measurement needs of engineers and technicians in various industries. These models offer a combination of advanced technologies and features that enhance their functionality and usability.Starting with the HP E4440A, this spectrum analyzer is well-known for its wide frequency range and excellent resolution bandwidth, making it ideal for characterizing RF signals. It is capable of analyzing signals from 9 kHz up to 1.5 GHz, providing a comprehensive tool for capturing a wide spectrum of frequencies. The E4440A features a sophisticated built-in signal analysis capability, including demodulation and specialized measurement functions that assist in the evaluation of complex signals.
The E4446A elevates performance further with a frequency range extending up to 6 GHz. This model includes advanced phase noise measurement capabilities, which are crucial for testing communication systems and ensuring signal integrity. Its large color display coupled with a user-friendly interface allows for easy navigation through various measurement settings.
For deeper insights into signal behavior, the HP E4445A stands out with its ability to perform real-time spectrum analysis. This feature allows engineers to capture transient signals and analyze them effectively, which is essential in modern RF design and troubleshooting. The E4445A also supports a range of modulation analysis tools enabling comprehensive testing of communication systems.
Meanwhile, the E4448A is recognized for its high dynamic range and low noise floor. These characteristics are essential for analyzing weak signals in the presence of stronger ones. Its enhanced sensitivity allows engineers to detect signals buried in noise, which is vital for applications such as spectrum monitoring and interference analysis.
Finally, the HP E4443A is tailored for more specialized applications, featuring a frequency range up to 3 GHz. It incorporates advanced digital signal processing techniques that facilitate accurate measurements even in challenging environments. Its portability and robust design make it a preferred choice for field applications, allowing users to perform spectrum analysis where needed.
In summary, the HP E4440A, E4446A, E4445A, E4448A, and E4443A spectrum analyzers offer a rich set of features and technologies that cater to the evolving demands of RF engineers. With their superior performance characteristics, they serve as invaluable tools across a variety of testing and measurement applications in the telecommunications and electronics sectors.

