wwwSide Beam..reelschelVi wmatic..com
(QuadraBeamTM Only)
Side Beam View shows sonar information from both the left and right 90° 455 kHz beams and the 200 kHz
Side Beam View
Bottom Presentation
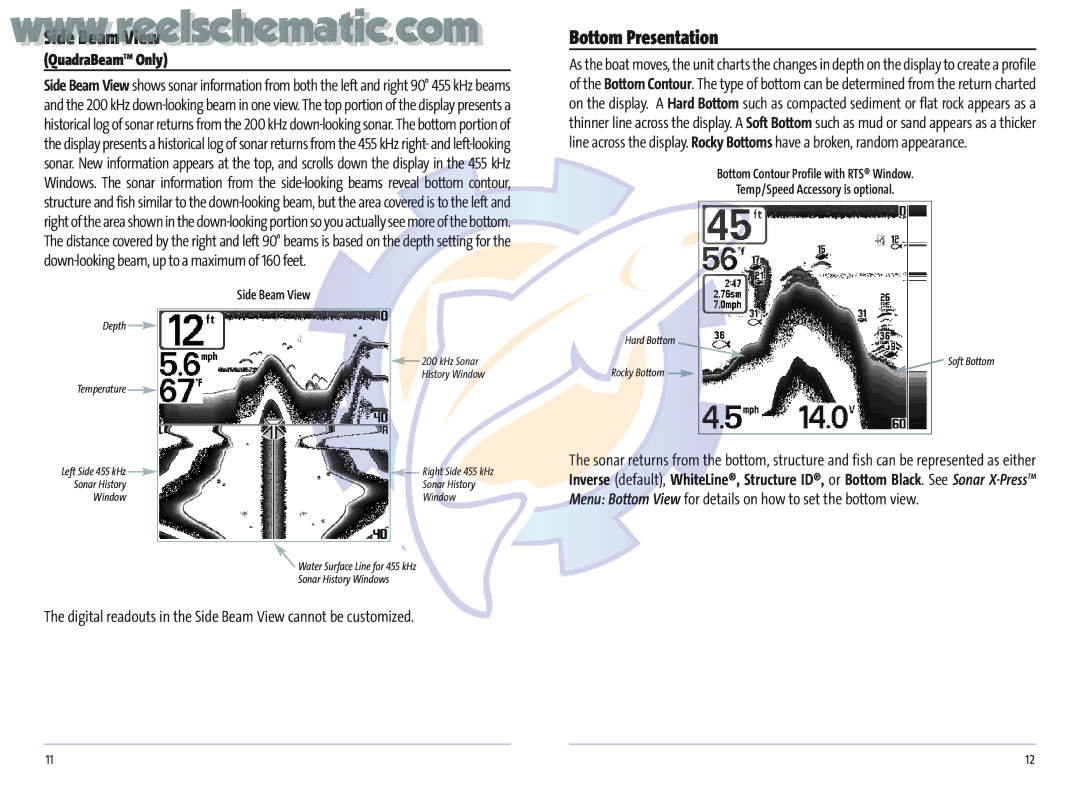
As the boat moves, the unit charts the changes in depth on the display to create a profile of the Bottom Contour. The type of bottom can be determined from the return charted on the display. A Hard Bottom such as compacted sediment or flat rock appears as a thinner line across the display. A Soft Bottom such as mud or sand appears as a thicker line across the display. Rocky Bottoms have a broken, random appearance.
Bottom Contour Profile with RTS® Window.
Temp/Speed Accessory is optional.
Depth ![]()
Temperature ![]()
Left Side 455 kHz ![]()
Sonar History
Window
![]() 200 kHz Sonar
200 kHz Sonar
History Window
![]() Right Side 455 kHz
Right Side 455 kHz
Sonar History
Window
![]() Water Surface Line for 455 kHz
Water Surface Line for 455 kHz
Sonar History Windows
Hard Bottom
Soft Bottom
Rocky Bottom ![]()
The sonar returns from the bottom, structure and fish can be represented as either Inverse (default), WhiteLine®, Structure ID®, or Bottom Black. See Sonar
The digital readouts in the Side Beam View cannot be customized.
11 | 12 |