The graphic representation of the bottom may vary considerably depending on the composition and regularity of the bottom surface (see interpreting the On-screen Information). Any sonar return which is determined to be not a part of the bottom is shown between the surface and the bottom. If this return is determined to be a fish, one of several fish shapes is drawn which indicates the size, depth, and location of the fish (see Interpreting the On-screen information).
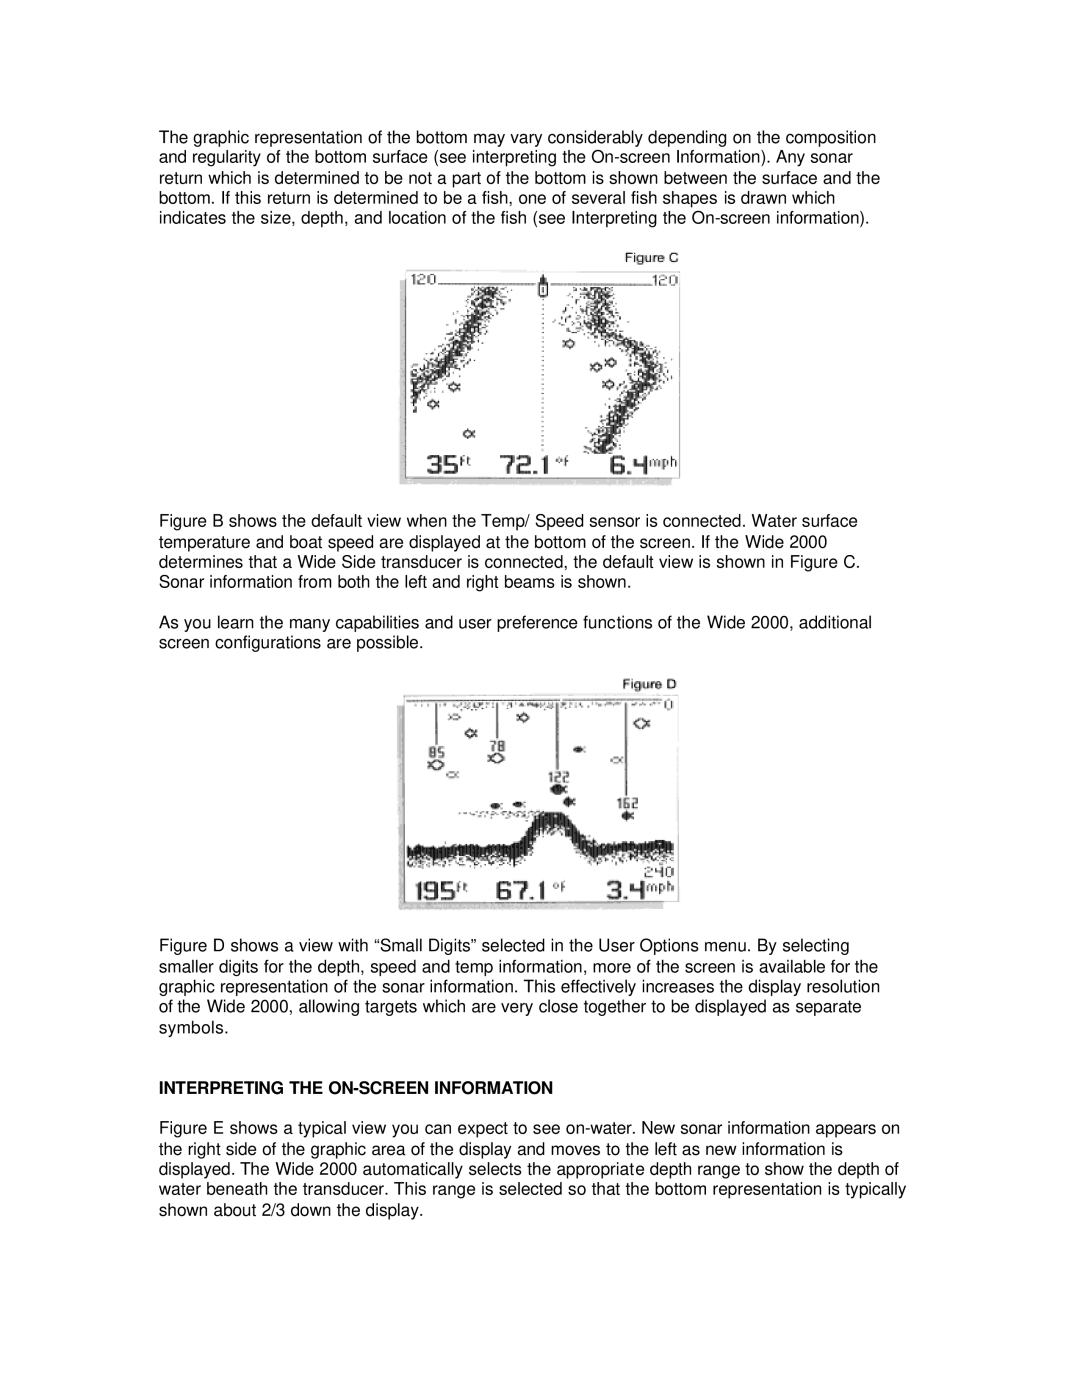
Figure B shows the default view when the Temp/ Speed sensor is connected. Water surface temperature and boat speed are displayed at the bottom of the screen. If the Wide 2000 determines that a Wide Side transducer is connected, the default view is shown in Figure C. Sonar information from both the left and right beams is shown.
As you learn the many capabilities and user preference functions of the Wide 2000, additional screen configurations are possible.
Figure D shows a view with “Small Digits” selected in the User Options menu. By selecting smaller digits for the depth, speed and temp information, more of the screen is available for the graphic representation of the sonar information. This effectively increases the display resolution of the Wide 2000, allowing targets which are very close together to be displayed as separate symbols.
INTERPRETING THE ON-SCREEN INFORMATION
Figure E shows a typical view you can expect to see on-water. New sonar information appears on the right side of the graphic area of the display and moves to the left as new information is displayed. The Wide 2000 automatically selects the appropriate depth range to show the depth of water beneath the transducer. This range is selected so that the bottom representation is typically shown about 2/3 down the display.