Relation between Oxygen Saturation and Partial Pressure
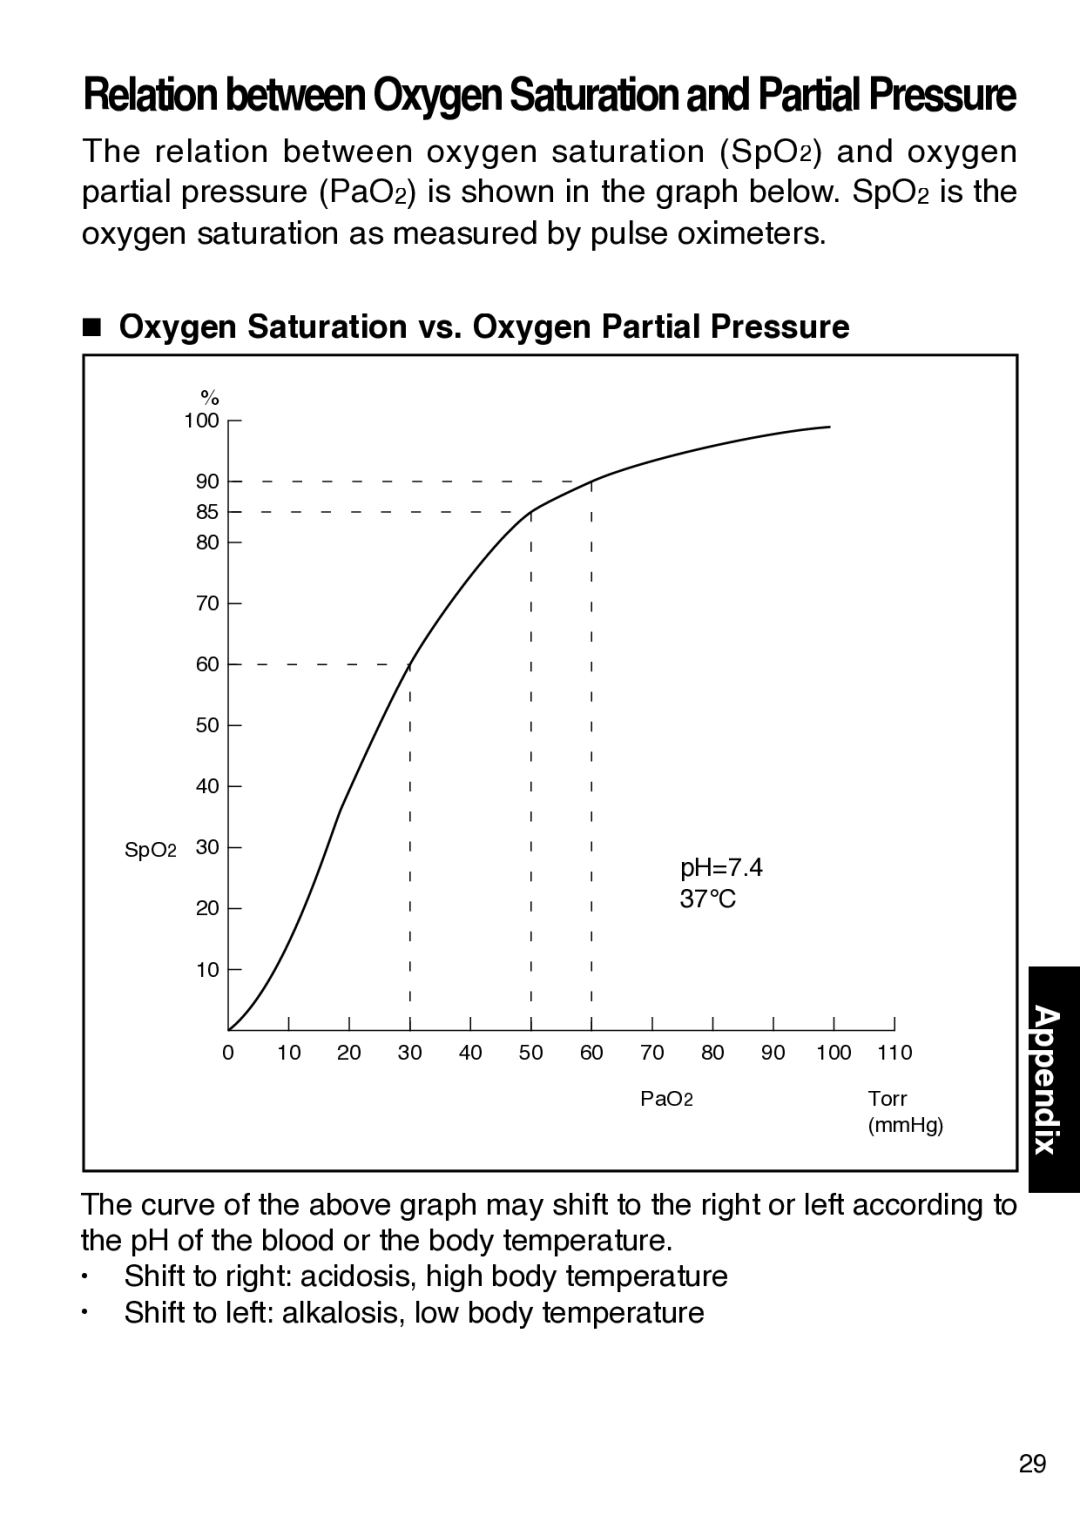
The relation between oxygen saturation (SpO2 ) and oxygen partial pressure (PaO2) is shown in the graph below. SpO2 is the
oxygen saturation as measured by pulse oximeters.
■Oxygen Saturation vs. Oxygen Partial Pressure
%
100
90
85
80
70
60
50
40
SpO2 30
20
10
|
|
|
|
|
|
|
| pH=7.4 |
|
| |
|
|
|
|
|
|
|
| 37°C |
|
|
|
0 | 10 | 20 | 30 | 40 | 50 | 60 | 70 | 80 | 90 | 100 | 110 |
|
|
|
|
|
|
| PaO2 |
|
| Torr | |
|
|
|
|
|
|
|
|
|
|
| (mmHg) |
Appendix
The curve of the above graph may shift to the right or left according to the pH of the blood or the body temperature.
•Shift to right: acidosis, high body temperature
•Shift to left: alkalosis, low body temperature
29
