
WS-9057U specifications
The La Crosse Technology WS-9057U is an advanced wireless weather station designed for those who want to monitor atmospheric conditions with precision and ease. This compact device combines functionality with user-friendly features, making it an excellent choice for both casual users and weather enthusiasts alike.At the core of the WS-9057U is its ability to provide real-time weather data. Equipped with a wireless outdoor sensor, it accurately measures outdoor temperature and humidity levels, transmitting the information back to the indoor display unit. The sensor features a robust design that ensures optimal performance in various weather conditions, allowing users to monitor their environment effectively.
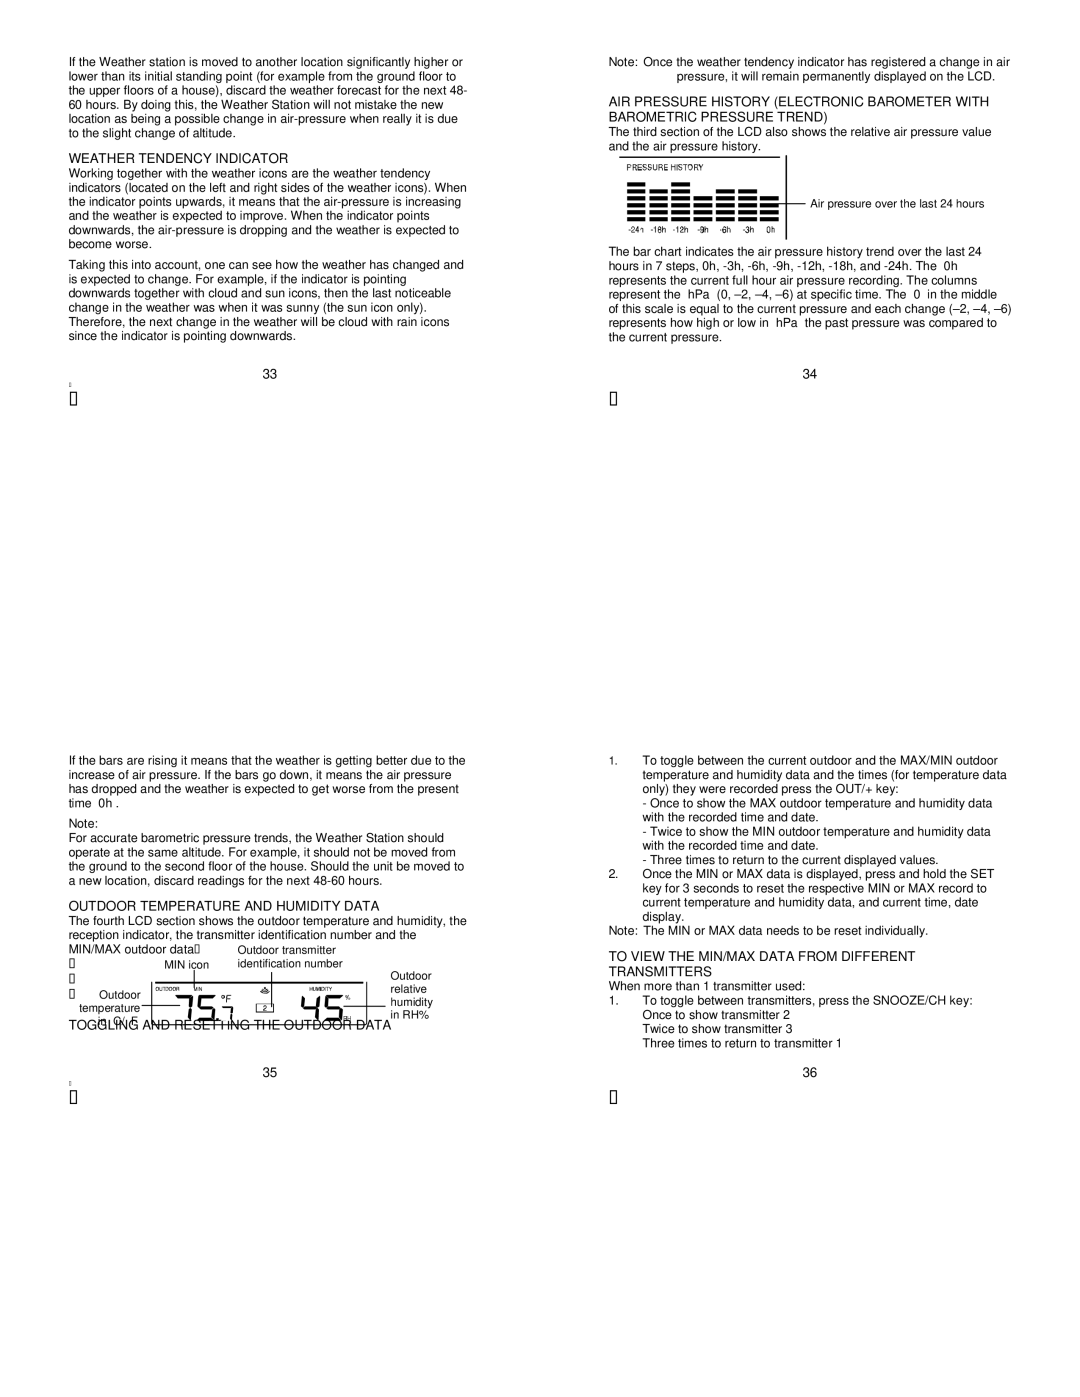
One of the standout features of the WS-9057U is its ability to display multiple weather parameters simultaneously. Users can enjoy a comprehensive view of the current outdoor temperature, humidity, and historical data for better context. The device also includes a memorable display of minimum and maximum temperature and humidity readings, enabling users to track changes over time.
The WS-9057U employs wireless technology to ensure seamless communication between the sensor and the display unit. Its 433 MHz RF signal provides a range of up to 330 feet, making placement options versatile. Users can position the outdoor sensor away from the house or garage, providing flexibility to monitor atmospheric conditions in different parts of their property.
In addition to its weather measuring capabilities, the La Crosse Technology WS-9057U features a clock with a snooze function, ensuring that it serves not only as a weather station but also as a practical household accessory. Users can also benefit from a user-friendly interface that makes navigation through its various settings and options easy.
Energy efficiency is another commendable characteristic of the WS-9057U. The device operates on simple, cost-effective batteries, providing convenience and reducing the need for frequent replacements. Coupled with efficient power management, users can enjoy long-term functionality without the hassle of constant maintenance.
The La Crosse Technology WS-9057U is an impressive combination of technology, simplicity, and functionality. Whether you’re interested in monitoring local weather conditions for planning activities or simply wish to enhance your home’s meteorological knowledge, the WS-9057U captures the essence of a reliable weather station, making it an appealing addition to any household.