Navini Networks, Inc. | PMX User’s Guide |
History Graphs
Parameters
NavDiag Screen Options
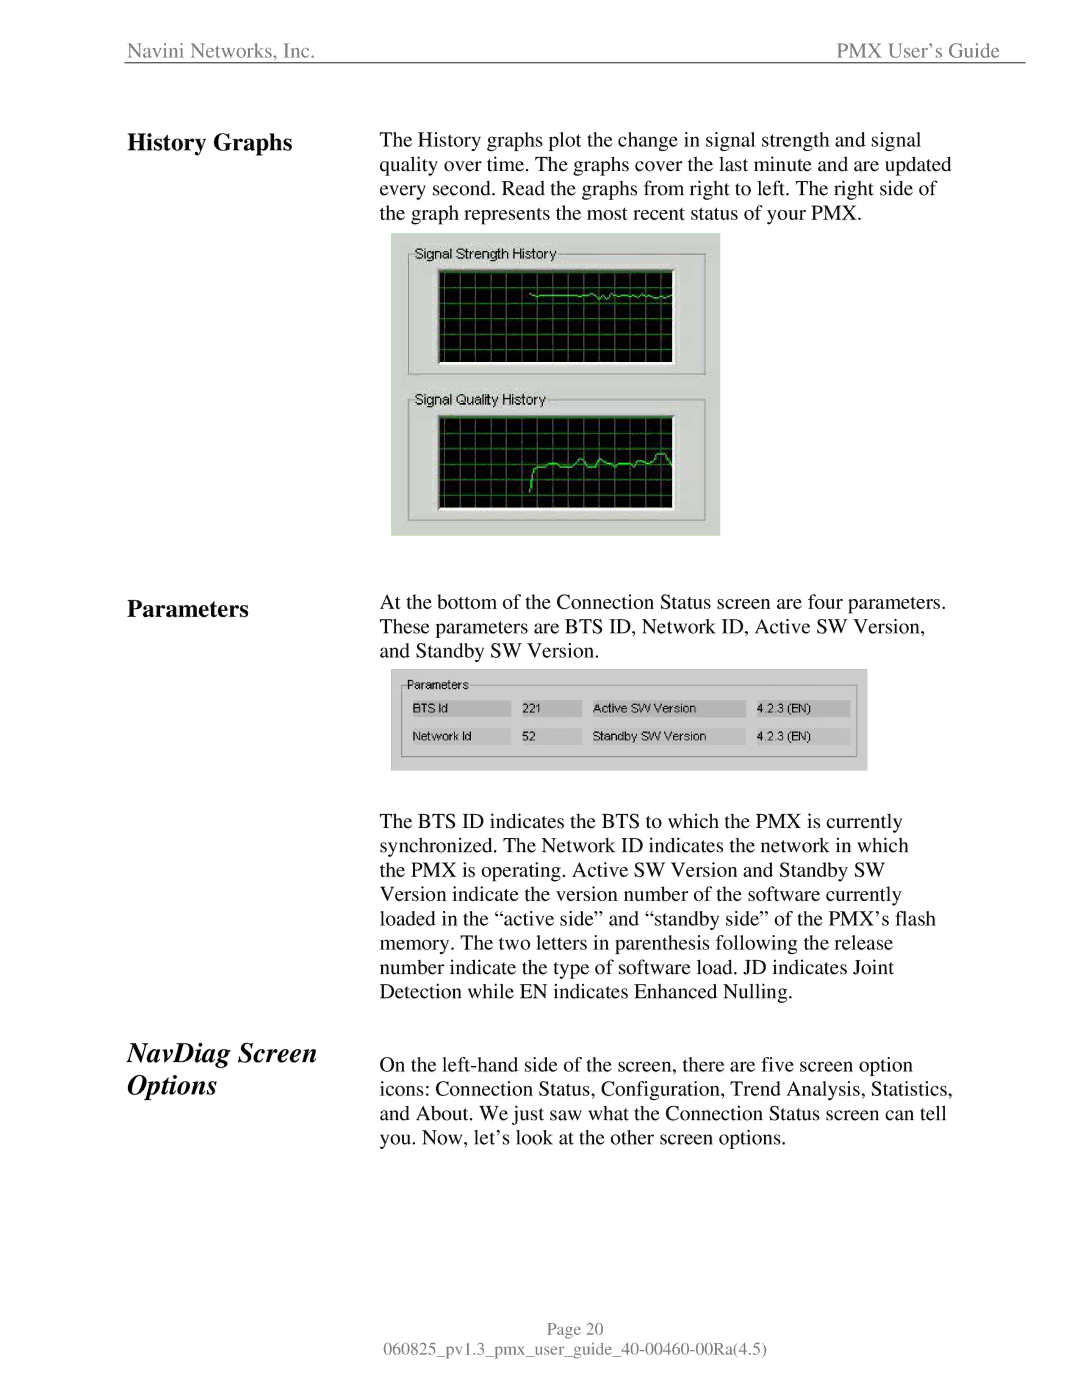
The History graphs plot the change in signal strength and signal quality over time. The graphs cover the last minute and are updated every second. Read the graphs from right to left. The right side of the graph represents the most recent status of your PMX.
At the bottom of the Connection Status screen are four parameters. These parameters are BTS ID, Network ID, Active SW Version, and Standby SW Version.
The BTS ID indicates the BTS to which the PMX is currently synchronized. The Network ID indicates the network in which the PMX is operating. Active SW Version and Standby SW Version indicate the version number of the software currently loaded in the “active side” and “standby side” of the PMX’s flash memory. The two letters in parenthesis following the release number indicate the type of software load. JD indicates Joint Detection while EN indicates Enhanced Nulling.
On the
Page 20