Chapter
SV Sound
Option 2: Measure the Combined FR of the Speakers and Subwoofer:
To measure the combined FR of the front speakers and subwoofer (to in- clude the digital crossover in your processor), connect your sound card output to an analog input on your processor. Make sure the analog input is configured to use the digital crossover between the speakers and the sub- woofer. Use the Excel spreadsheet named Speaker And Subwoofer Com- bined Frequency Response, which will plot the frequency response from
11.2Hz to 201.6 Hz. Input your raw (direct read) values from your SPL meter into the green band of frequencies in the Raw SPL Data worksheet, and the Frequency Response worksheet will plot the combined FR of the speakers and subwoofer.
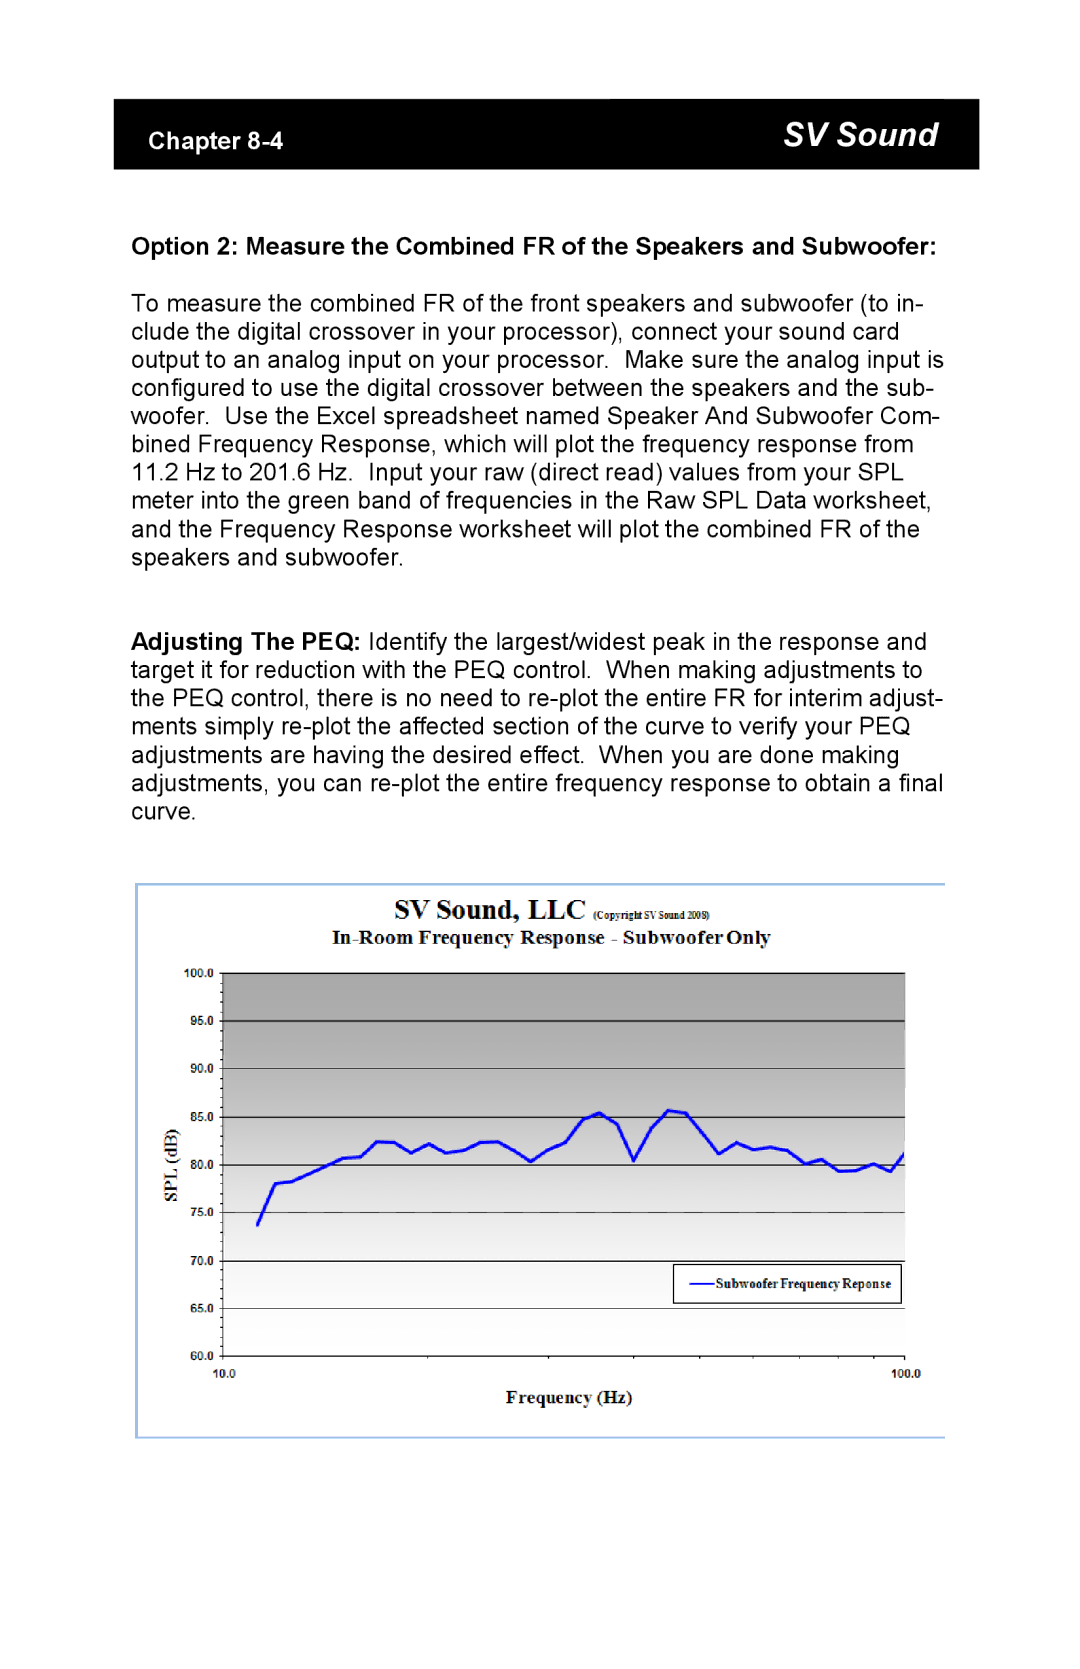
Adjusting The PEQ: Identify the largest/widest peak in the response and target it for reduction with the PEQ control. When making adjustments to the PEQ control, there is no need to