SV Sound SB12-Plus specifications SV Sound, Chapter

Models: SB12-Plus

1 19
Download 19 pages 11.23 Kb
Page 17
Image 17
Set the Frequency control to the approximate center frequency of the largest peak. Set the Q control to HI (narrowest bandwidth), and set the Level control to MAX. Play the test tones again and re-measure and re- plot the affected portion of the FR curve and visually evaluate your re- sults. Simple trial/error will then allow you to adjust all three controls to shape the PEQ cut to achieve the desired effect.

Chapter 8-5

SV Sound

Set the Frequency control to the approximate center frequency of the largest peak. Set the Q control to HI (narrowest bandwidth), and set the Level control to MAX. Play the test tones again and re-measure and re- plot the affected portion of the FR curve and visually evaluate your re- sults. Simple trial/error will then allow you to adjust all three controls to shape the PEQ cut to achieve the desired effect.

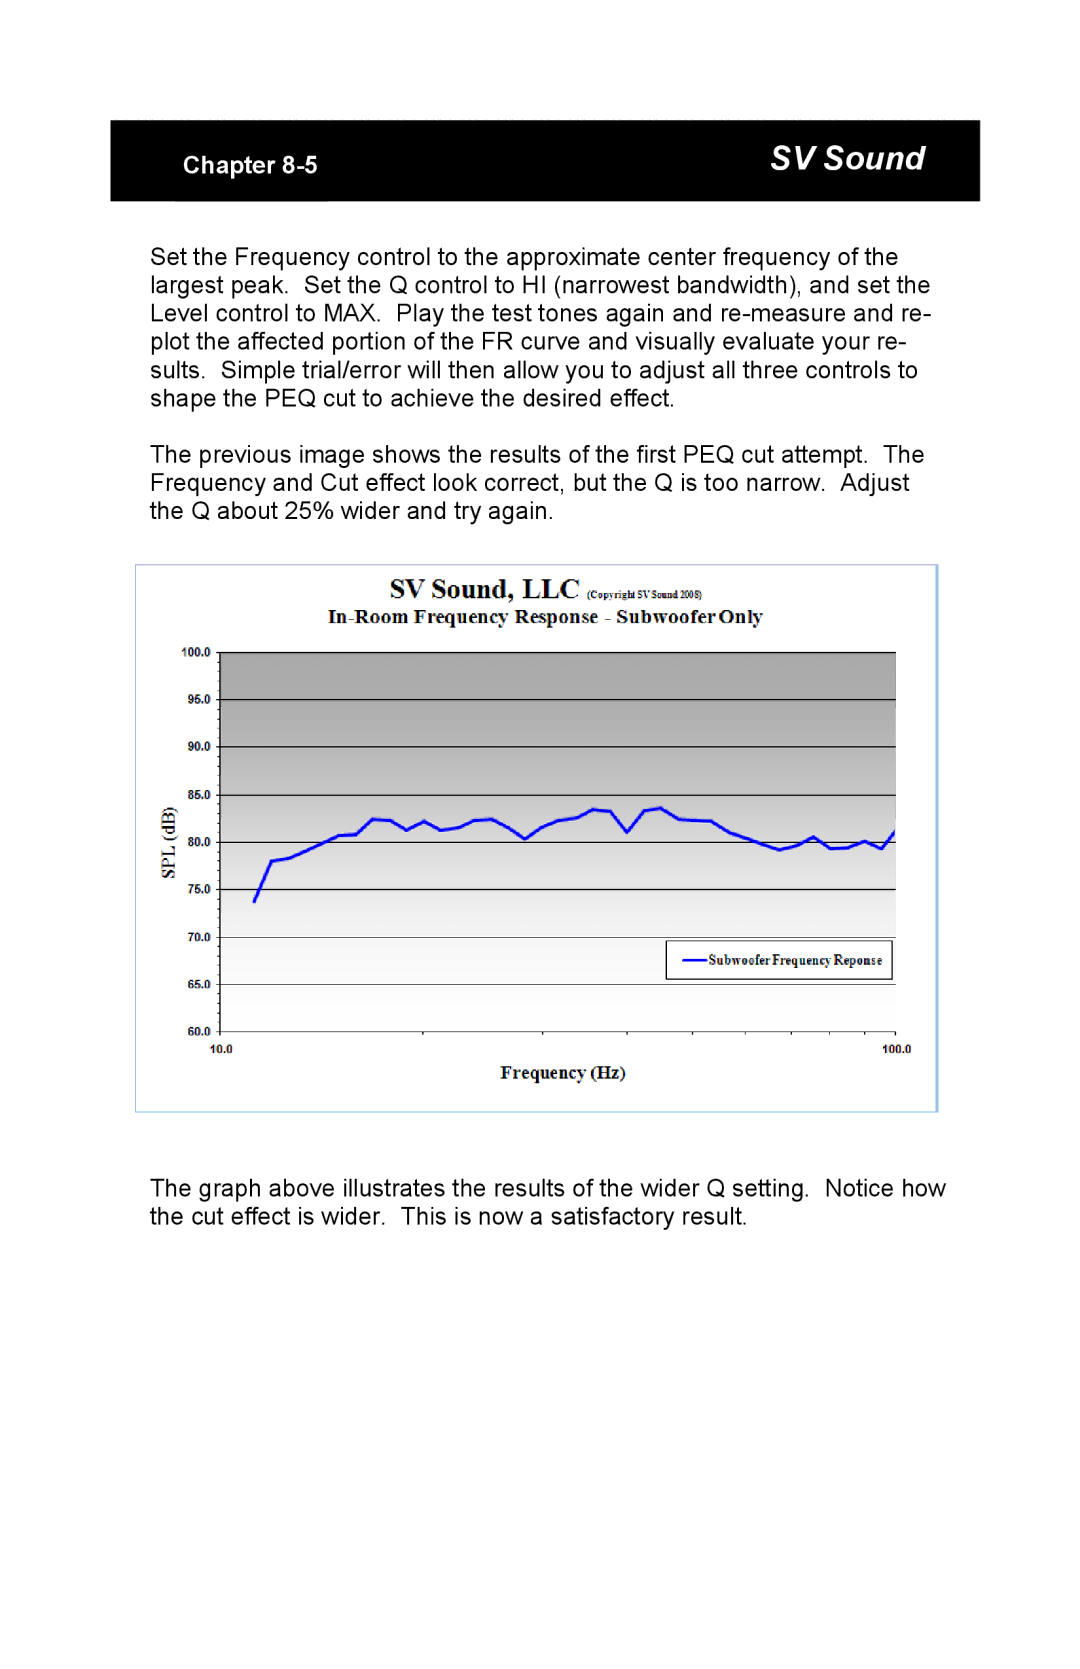
The previous image shows the results of the first PEQ cut attempt. The Frequency and Cut effect look correct, but the Q is too narrow. Adjust the Q about 25% wider and try again.

The graph above illustrates the results of the wider Q setting. Notice how the cut effect is wider. This is now a satisfactory result.

Page 17
Image 17
SV Sound SB12-Plus specifications SV Sound, Chapter