2.Press ![]() .
.
3.Enter a value for X1.
4.Press ![]() .
.
![]() In
In
![]() In
In
![]() .
.
5.Repeat steps 3 and 4 unitl all data points are entered.
You must press ![]() or
or ![]() to save the last data point or FRQ value entered. If you add or delete data points, the unit automatically reorders the list.
to save the last data point or FRQ value entered. If you add or delete data points, the unit automatically reorders the list.
6.When all points and frequencies are entered:
![]() Press
Press ![]() to display the menu of variables (see table for definitions) and their current values, or
to display the menu of variables (see table for definitions) and their current values, or
![]() Press
Press ![]() to return to the blank STAT screen. You can do calculations with data variables (x, y, etc.).
to return to the blank STAT screen. You can do calculations with data variables (x, y, etc.).
Select a variable from the ![]() menu and then press
menu and then press
![]() to evaluate the calculation.
to evaluate the calculation.
7.When finished:
![]() Press
Press ![]()
![]() and select CLRDATA to clear all data points without exiting STAT mode, or
and select CLRDATA to clear all data points without exiting STAT mode, or
![]() Press
Press ![]()
![]()
![]() to clear all data points, variable and FRQ values, and to exit STAT mode (STAT indicator turns off).
to clear all data points, variable and FRQ values, and to exit STAT mode (STAT indicator turns off).
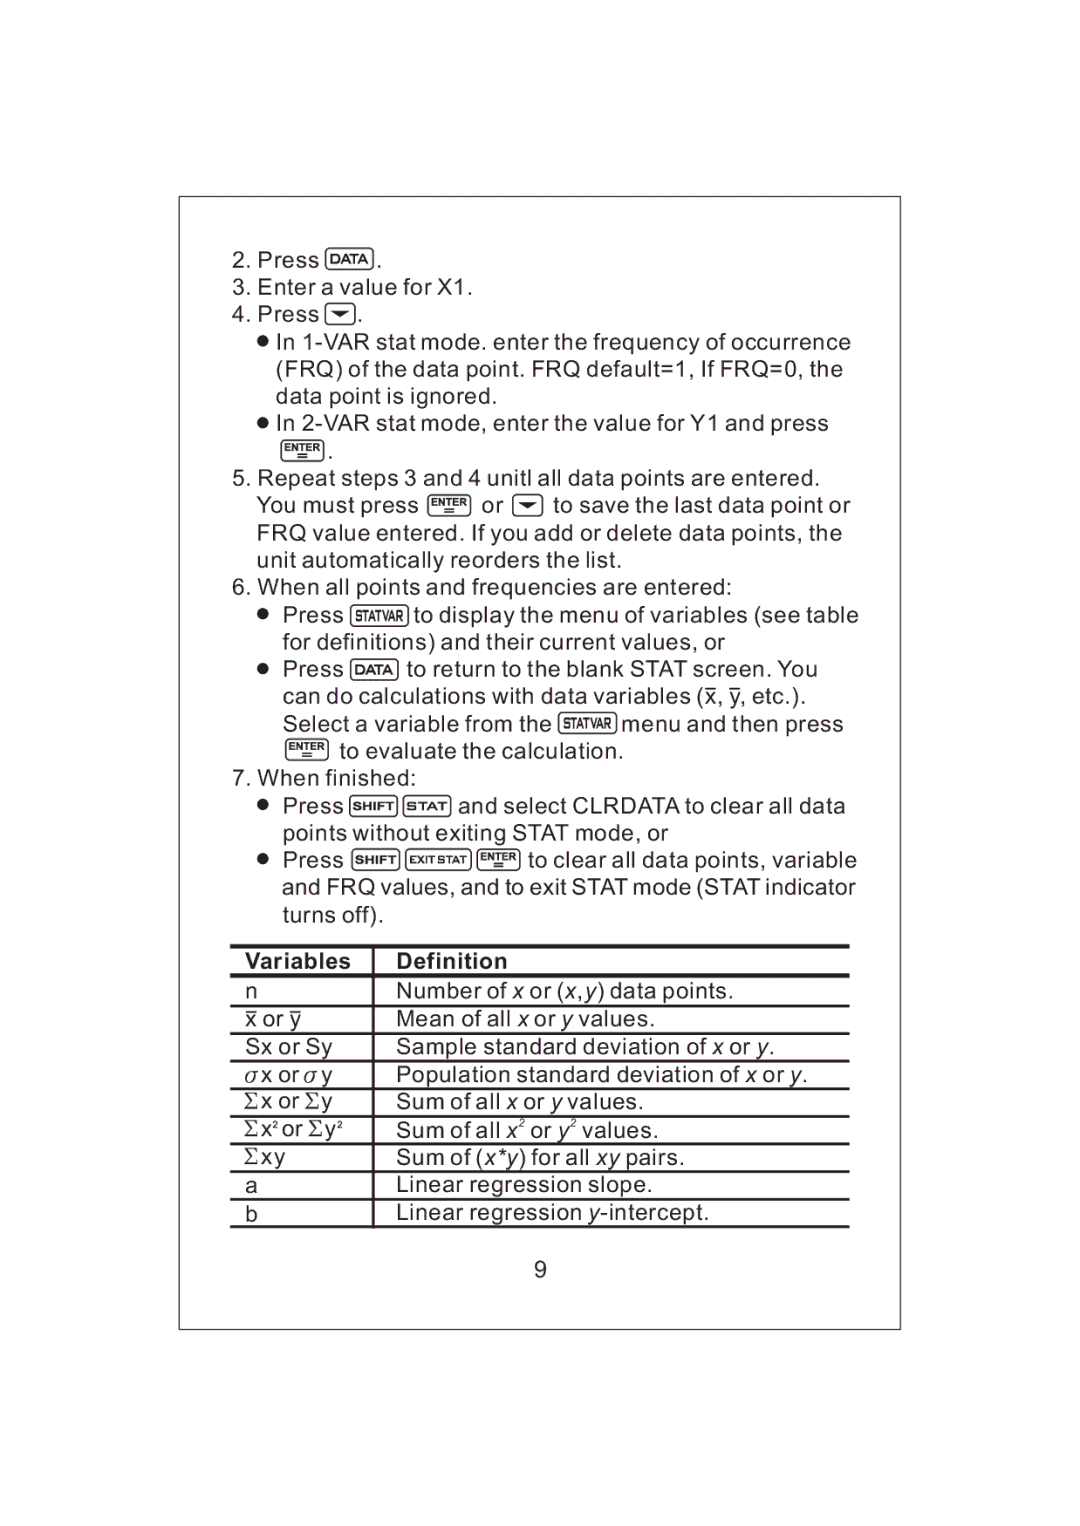
Variables | Definition |
nNumber of x or (x,y) data points.
x or y |
| Mean of all x or y values. |
Sx or Sy | Sample standard deviation of x or y. | |
x or | y | Population standard deviation of x or y. |
x or | y | Sum of all x or y values. |
x or | y | Sum of all x2 or y2 values. |
xy |
| Sum of (x*y) for all xy pairs. |
aLinear regression slope.
bLinear regression
9