Manuals
/
Waves
/
Home Audio
/
Speaker System
Waves
Linear-Phase MultiBand Software Audio Processor
manual
Waves LinMB software guide
Models:
Linear-Phase MultiBand Software Audio Processor
1
14
27
27
Download
27 pages
55.59 Kb
11
12
13
14
15
16
17
18
Page 14
Image 14
Page 13
Page 15
Page 14
Image 14
Page 13
Page 15
Contents
Waves LinMB software guide page 1 of
Waves - Linear-PhaseMultiBand
Software Audio Processor Users Guide
Chapter 1 - Introduction
Waves LinMB software guide page 3 of
Chapter 2 - Basic Operation
Start off using the Processor defaults
Practice Makes Perfect
Waves LinMB software guide page 6 of
Chapter 3 - Specialties of the Chef
Waves LinMB software guide page 8 of
Waves LinMB software guide page 9 of
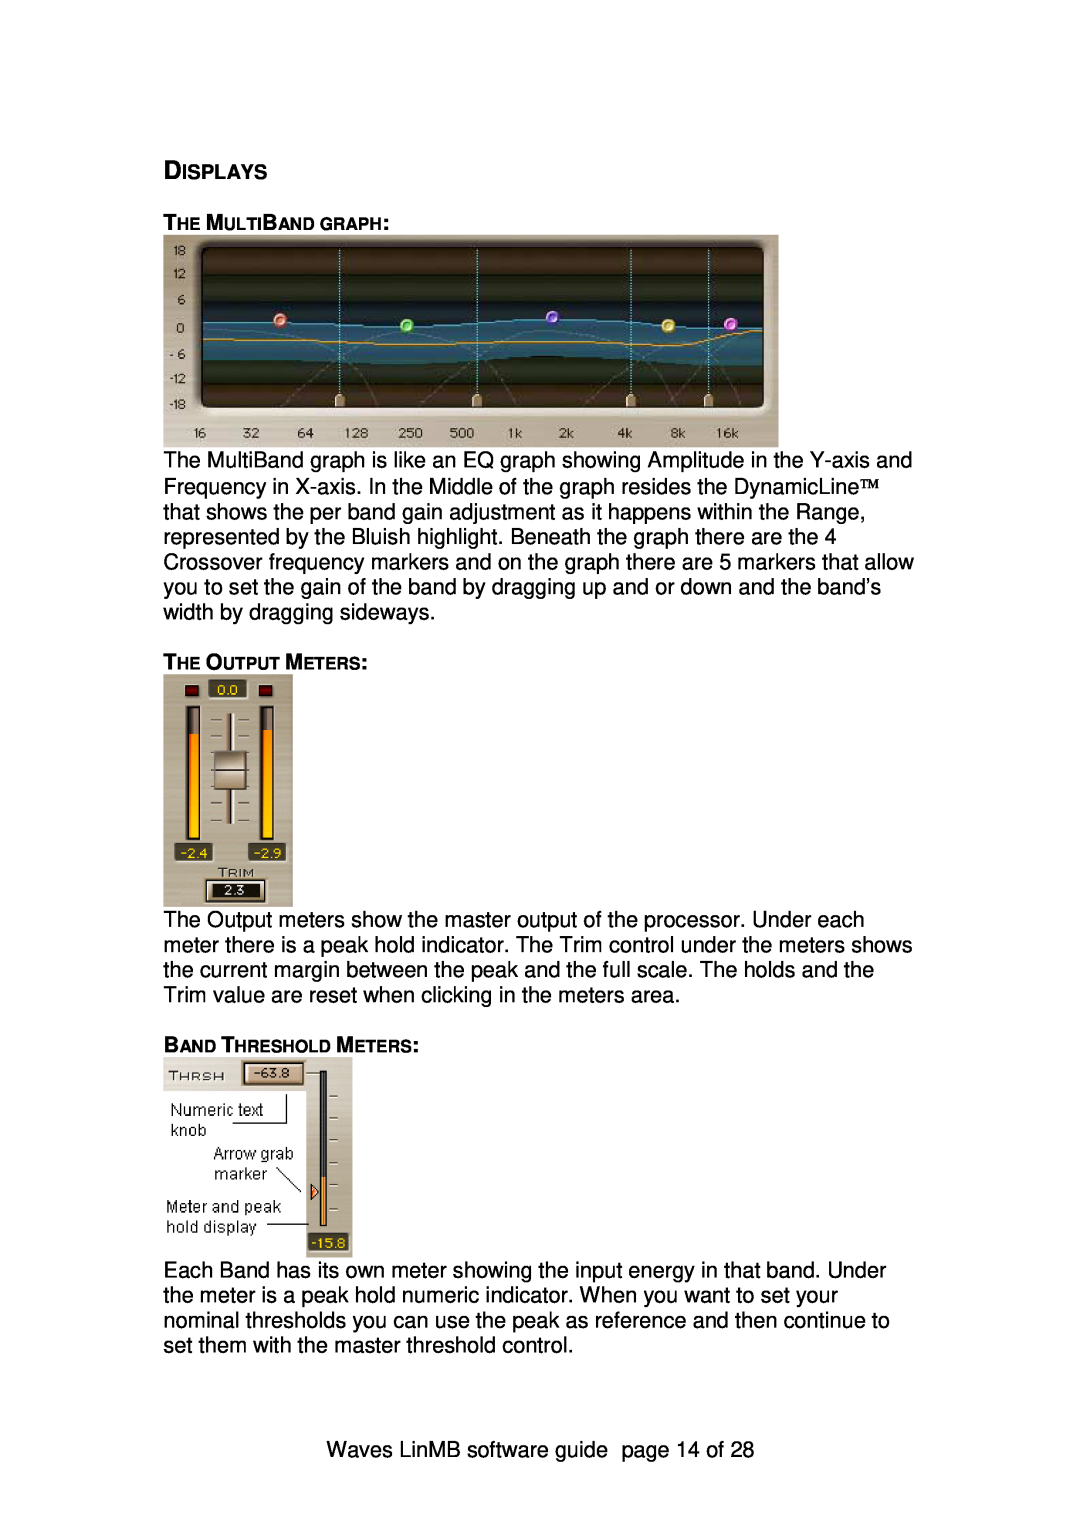
Chapter 4 - LinMB Controls and Displays
Individual Band Controls
Crossovers - Xover
Output Section
Global Behavior Settings
Opto or Electro. Default - Electro
Waves LinMB software guide page 14 of
Chapter 5 - Range and Threshold Concept
Waves LinMB software guide page 16 of
Positive Range
Negative Range
Waves LinMB software guide page 18 of
Waves LinMB software guide page 19 of
Chapter 6 - Examples of use
Play some audio thru the Low level Enhancer setup
Load the Voiceover preset from the Load menu
Load the Uncompressor preset
Waves LinMB software guide page 23 of
Basic multi
Chapter 7 - Factory Presets
Full Reset
Hard basic
Upward Comp +3dB
Deeper
Low-levelEnhancer
Upward Comp +5dB
UNcompressor
Multi Electro Mastering
Adaptive Multi Electro Mastering
BassComp/HiFreqLimit
Setup with Auto-Makeup
BassComp/De-Esser
Too Much Limiting
Top
Page
Image
Contents