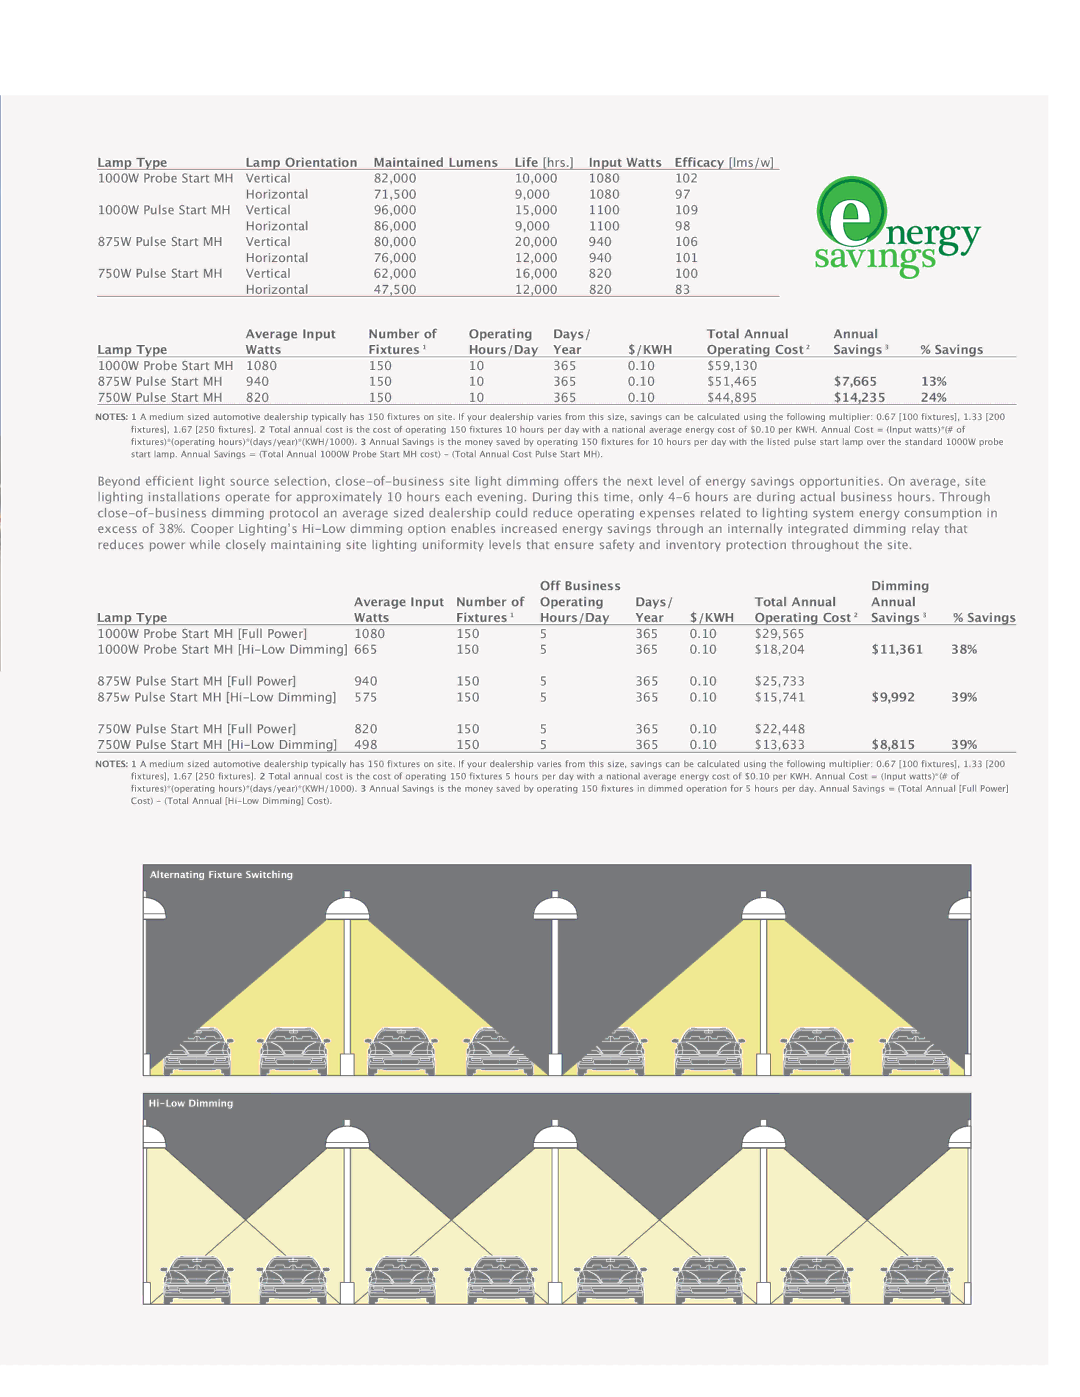
| Lamp Type | Lamp Orientation | Maintained Lumens Life [hrs.] | Input Watts | Efficacy [lms/w] |
|
| ||||
| 1000W | Probe Start MH | Vertical | 82,000 | 10,000 | 1080 | 102 |
|
|
| |
| 1000W | Pulse Start MH | Horizontal | 71,500 | 9,000 |
| 1080 | 97 |
|
|
|
| Vertical | 96,000 | 15,000 | 1100 | 109 |
|
|
| |||
| 875W Pulse Start MH | Horizontal | 86,000 | 9,000 |
| 1100 | 98 |
|
|
| |
| Vertical | 80,000 | 20,000 | 940 | 106 |
|
|
| |||
| 750W Pulse Start MH | Horizontal | 76,000 | 12,000 | 940 | 101 |
|
|
| ||
| Vertical | 62,000 | 16,000 | 820 | 100 |
|
|
| |||
|
|
| Horizontal | 47,500 | 12,000 | 820 | 83 |
|
|
| |
| Lamp Type | Average Input | Number of | Operating | Days/ | Total Annual | Annual | % Savings | |||
| Watts | Fixtures 1 | Hours/Day | Year | $/KWH | Operating Cost 2 | Savings 3 | ||||
| 1000W | Probe Start MH | 1080 | 150 | 10 | 365 | 0.10 | $59,130 |
| $7,665 | 13% |
875W Pulse Start MH | 940 | 150 | 10 | 365 | 0.10 | $51,465 |
| ||||
| 750W Pulse Start MH | 820 | 150 | 10 | 365 | 0.10 | $44,895 |
| $14,235 | 24% | |
NOTES: 1 A medium sized automotive dealership typically has 150 fixtures on site. If your dealership varies from this size, savings can be calculated using the following multiplier: 0.67 [100 fixtures], 1.33 [200 fixtures], 1.67 [250 fixtures]. 2 Total annual cost is the cost of operating 150 fixtures 10 hours per day with a national average energy cost of $0.10 per KWH. Annual Cost = (Input watts)*(# of fixtures)*(operating hours)*(days/year)*(KWH/1000). 3 Annual Savings is the money saved by operating 150 fixtures for 10 hours per day with the listed pulse start lamp over the standard 1000W probe start lamp. Annual Savings = (Total Annual 1000W Probe Start MH cost) - (Total Annual Cost Pulse Start MH).
Beyond efficient light source selection,
|
|
| Average Input | Number of | Off Business | Days/ |
| Total Annual | Dimming |
|
Lamp Type | Operating | $/KWH | Annual | % Savings | ||||||
Watts | Fixtures 1 | Hours/Day | Year | Operating Cost 2 | Savings 3 | |||||
1000W | Probe Start MH [Full Power] | 1080 | 150 | 5 | 365 | 0.10 | $29,565 | $11,361 | 38% | |
1000W | Probe Start MH | 150 | 5 | 365 | 0.10 | $18,204 | ||||
875W | Pulse Start MH [Full Power] | 940 | 150 | 5 | 365 | 0.10 | $25,733 | $9,992 | 39% | |
875w Pulse Start MH | 575 | 150 | 5 | 365 | 0.10 | $15,741 | ||||
750W | Pulse Start MH [Full Power] | 820 | 150 | 5 | 365 | 0.10 | $22,448 | $8,815 | 39% | |
750W | Pulse Start MH | 498 | 150 | 5 | 365 | 0.10 | $13,633 | |||
NOTES: 1 A medium sized automotive dealership typically has 150 fixtures on site. If your dealership varies from this size, savings can be calculated using the following multiplier: 0.67 [100 fixtures], 1.33 [200 fixtures], 1.67 [250 fixtures]. 2 Total annual cost is the cost of operating 150 fixtures 5 hours per day with a national average energy cost of $0.10 per KWH. Annual Cost = (Input watts)*(# of fixtures)*(operating hours)*(days/year)*(KWH/1000). 3 Annual Savings is the money saved by operating 150 fixtures in dimmed operation for 5 hours per day. Annual Savings = (Total Annual [Full Power] Cost) - (Total Annual
Alternating Fixture Switching
