Appendix C | Type IV™ White Paper | 386 |
|
| |
|
|
|
Input
Signal
Level
| TYPE IV™ |
| Over |
+12 | Region |
+8 |
|
+4 | 0 dB FS |
0 |
|
A/D Converter
Linear Region
Noise Floor
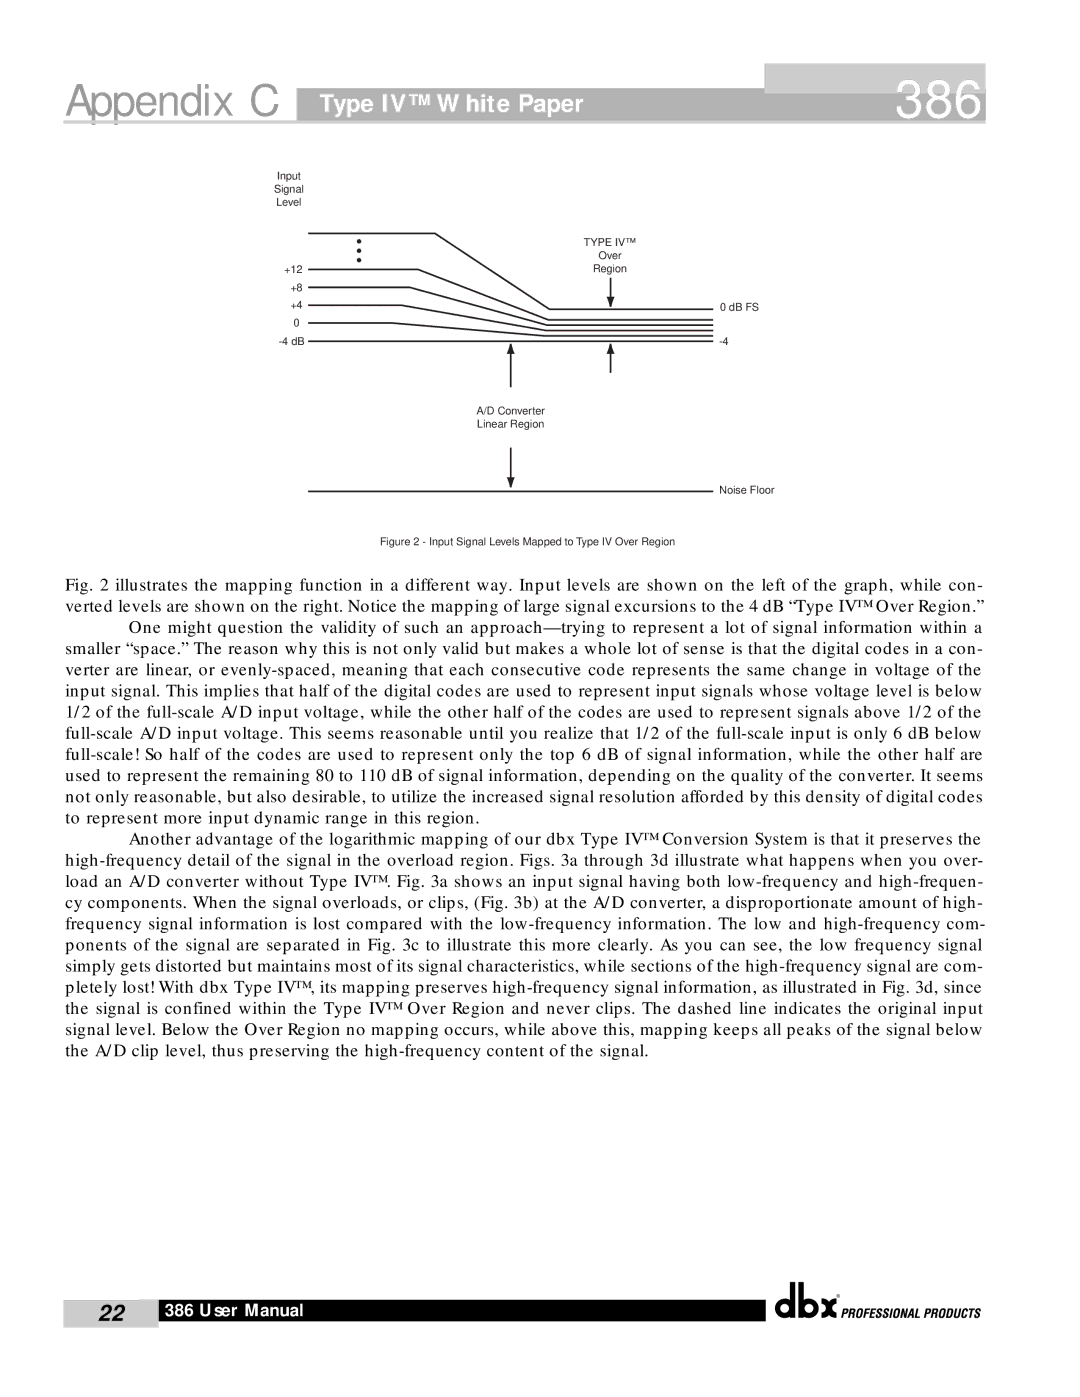
Figure 2 - Input Signal Levels Mapped to Type IV Over Region
Fig. 2 illustrates the mapping function in a different way. Input levels are shown on the left of the graph, while con- verted levels are shown on the right. Notice the mapping of large signal excursions to the 4 dB “Type IV™ Over Region.” One might question the validity of such an approach—trying to represent a lot of signal information within a smaller “space.” The reason why this is not only valid but makes a whole lot of sense is that the digital codes in a con- verter are linear, or evenly-spaced, meaning that each consecutive code represents the same change in voltage of the input signal. This implies that half of the digital codes are used to represent input signals whose voltage level is below 1/2 of the full-scale A/D input voltage, while the other half of the codes are used to represent signals above 1/2 of the full-scale A/D input voltage. This seems reasonable until you realize that 1/2 of the full-scale input is only 6 dB below full-scale! So half of the codes are used to represent only the top 6 dB of signal information, while the other half are used to represent the remaining 80 to 110 dB of signal information, depending on the quality of the converter. It seems not only reasonable, but also desirable, to utilize the increased signal resolution afforded by this density of digital codes
to represent more input dynamic range in this region.
Another advantage of the logarithmic mapping of our dbx Type IV™ Conversion System is that it preserves the high-frequency detail of the signal in the overload region. Figs. 3a through 3d illustrate what happens when you over- load an A/D converter without Type IV™. Fig. 3a shows an input signal having both low-frequency and high-frequen- cy components. When the signal overloads, or clips, (Fig. 3b) at the A/D converter, a disproportionate amount of high- frequency signal information is lost compared with the low-frequency information. The low and high-frequency com- ponents of the signal are separated in Fig. 3c to illustrate this more clearly. As you can see, the low frequency signal simply gets distorted but maintains most of its signal characteristics, while sections of the high-frequency signal are com- pletely lost! With dbx Type IV™, its mapping preserves high-frequency signal information, as illustrated in Fig. 3d, since the signal is confined within the Type IV™ Over Region and never clips. The dashed line indicates the original input signal level. Below the Over Region no mapping occurs, while above this, mapping keeps all peaks of the signal below the A/D clip level, thus preserving the high-frequency content of the signal.
®
22 | 386 User Manual |
|
|