Manuals
/
Delta Electronics
/
Computer Equipment
/
Power Supply
Delta Electronics
F48SA
manual
Electrical Characteristics Curves
Models:
F48SA
1
5
13
13
Download
13 pages
49.11 Kb
1
2
3
4
5
6
7
8
Specifications
DATASHEET DSF48SA2802512072007
Warranty
Output Voltage Adjustment TRIM
Thermal Testing Setup
Safety
Features Descriptions
Page 5
Image 5
Page 4
Page 6
Page 5
Image 5
Page 4
Page 6
Contents
OPTIONS
FEATURES
APPLICATIONS
DATASHEET DSF48SA2802512072007
INPUT CHARACTERISTICS
TECHNICAL SPECIFICATIONS
OUTPUT CHARACTERISTICS
DYNAMIC CHARACTERISTICS
36Vin
ELECTRICAL CHARACTERISTICS CURVES
48Vin
75Vin
For Positive Remote On/Off Logic
For Negative Remote On/Off Logic
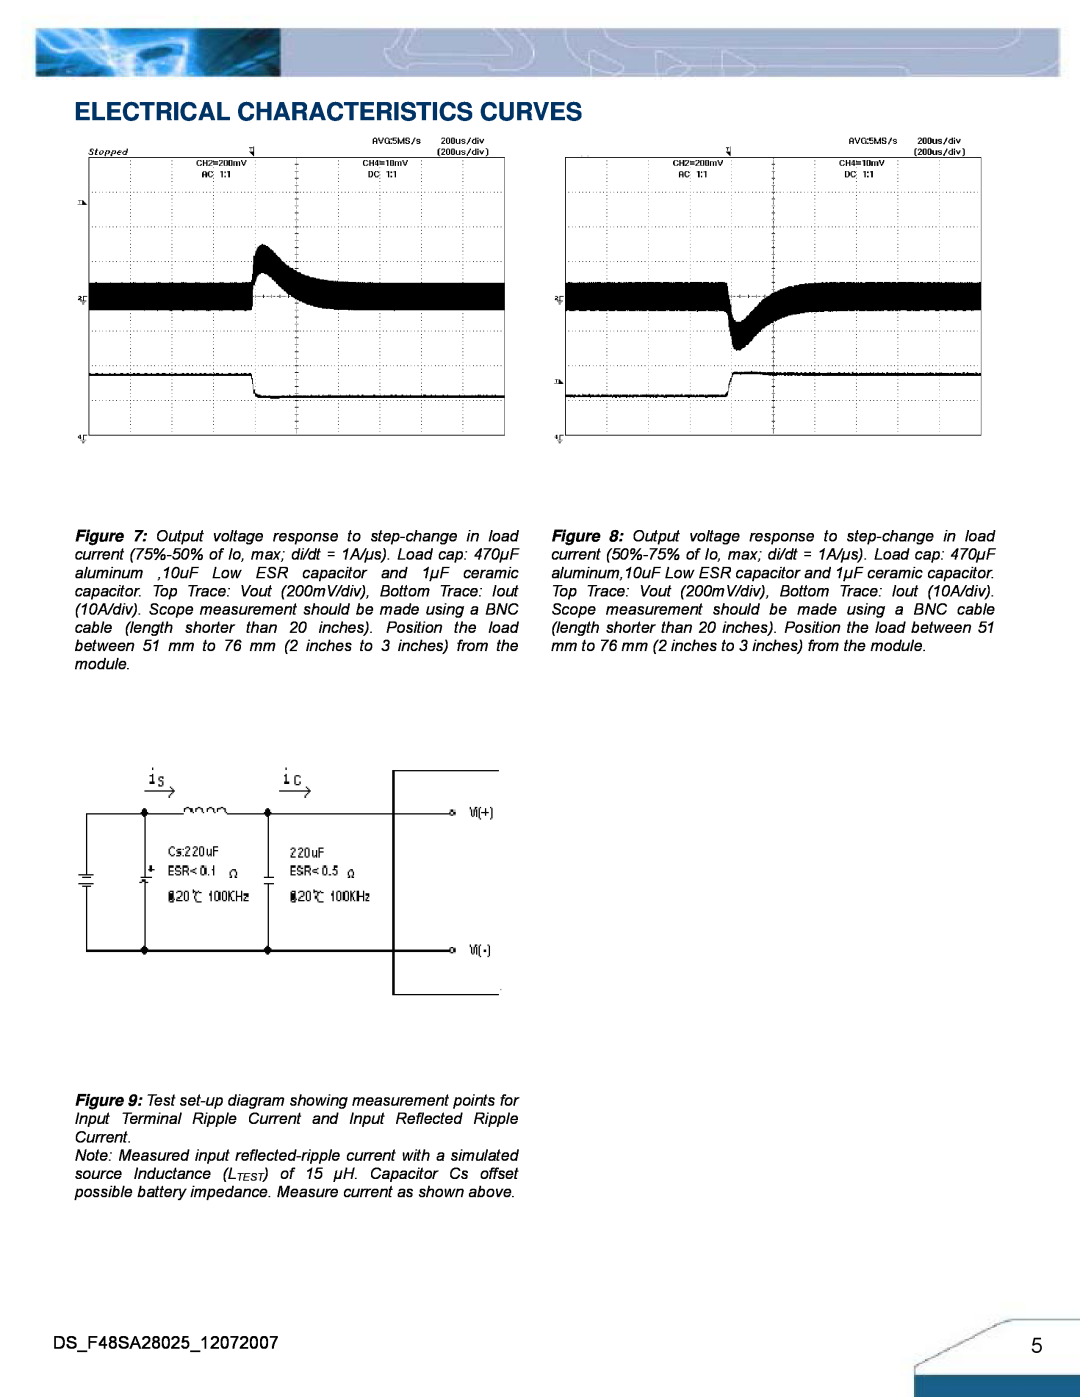
Figure 7 Output voltage response to step-change in load
Figure 12 Output voltage noise and ripple measurement test setup
Figure 13 Output voltage ripple at nominal input voltage and rated load current 100 mV/div. Load capacitance470uF aluminum, 1µF ceramic capacitor and 10µFlow ESR capacitor. Bandwidth 20 MHz. Scope measurement should be made using a BNC cable length shorter than 20 inches. Position the load between 51 mm to 76 mm 2 inches to 3 inches from the module
Soldering and Cleaning Considerations
Safety Considerations
DESIGN CONSIDERATIONS
Input Source Impedance
Over-Current Protection
FEATURES DESCRIPTIONS
Over-Voltage Protection
Over-Temperature Protection
Output Voltage Adjustment TRIM
FEATURES DESCRIPTIONS CON
THERMAL CONSIDERATIONS
Thermal Testing Setup
THERMAL CURVES
Thermal Derating
MECHANICAL DRAWING
Pin Specification
Pin No
Name
PART NUMBERING SYSTEM
WARRANTY
MODEL LIST
MODEL NAME
Top
Page
Image
Contents