ELECTRICAL CHARACTERISTICS CURVES
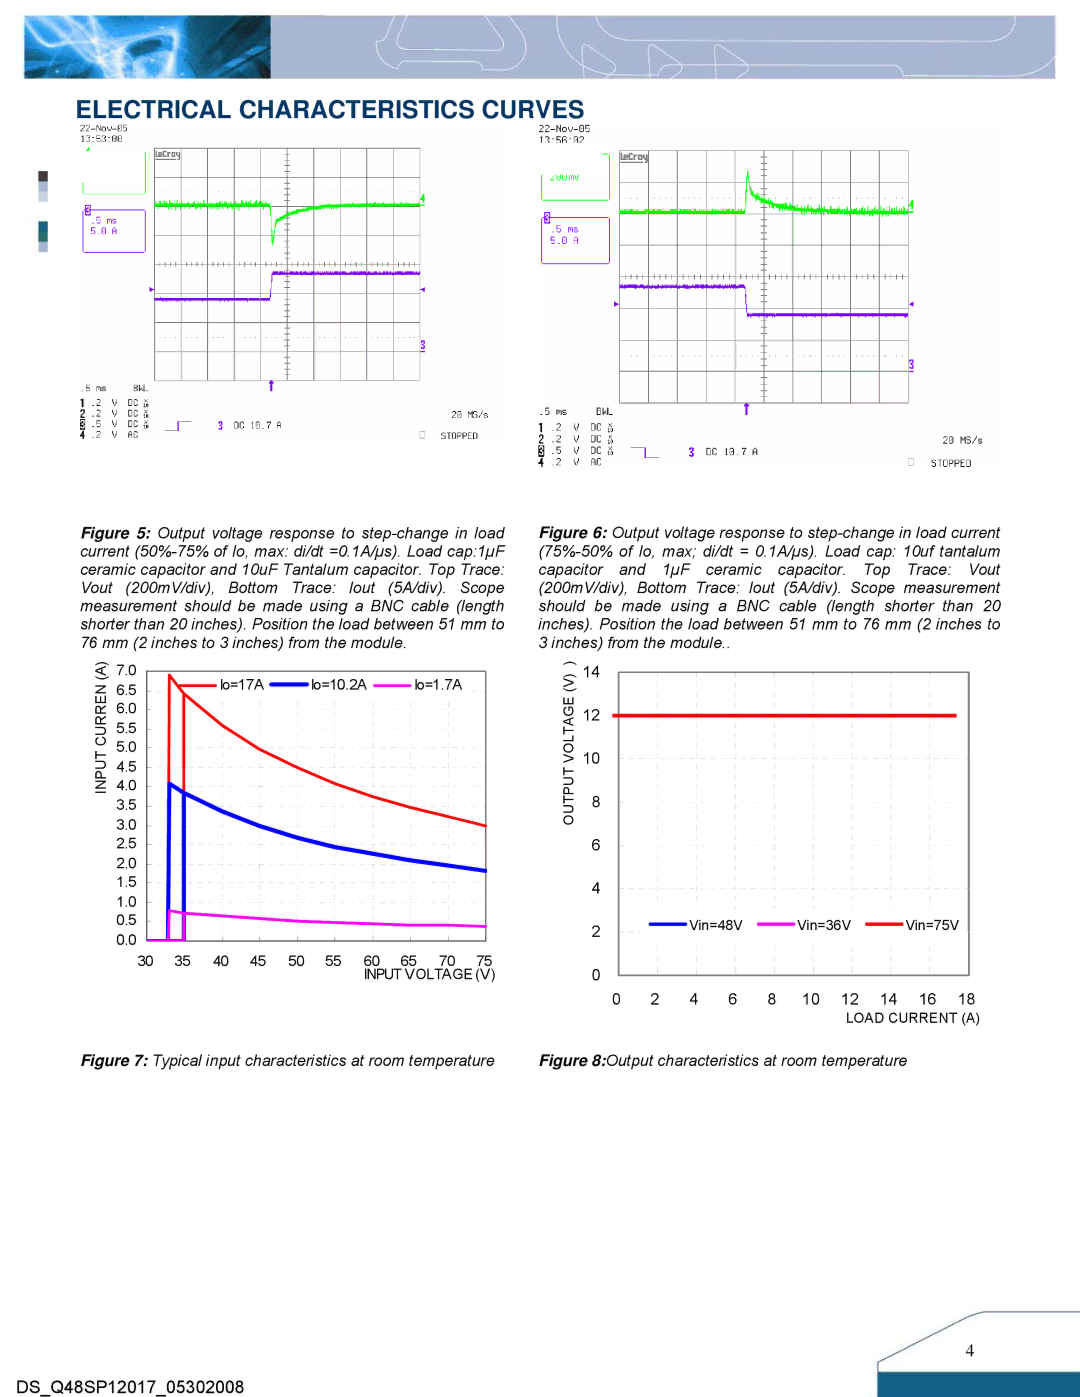
Figure 5: Output voltage response to step-change in load
current (50%-75% of Io, max: di/dt =0.1A/µs). Load cap:1µF ceramic capacitor and 10uF Tantalum capacitor. Top Trace: Vout (200mV/div), Bottom Trace: Iout (5A/div). Scope measurement should be made using a BNC cable (length shorter than 20 inches). Position the load between 51 mm to 76 mm (2 inches to 3 inches) from the module.
Figure 6: Output voltage response to step-change in load current
(75%-50% of Io, max; di/dt = 0.1A/µs). Load cap: 10uf tantalum
capacitor and 1µF ceramic capacitor. Top Trace: Vout
(200mV/div), Bottom Trace: Iout (5A/div). Scope measurement should be made using a BNC cable (length shorter than 20 inches). Position the load between 51 mm to 76 mm (2 inches to 3 inches) from the module..
CURRENINPUT(A) | 7.0 |
| Io=17A |
| Io=10.2A | Io=1.7A | VOLTAGEOUTPUT(V) ) | |||
6.5 |
|
| ||||||||
|
|
|
|
|
|
|
| |||
6.0 |
|
|
|
|
|
|
|
| ||
|
|
|
|
|
|
|
|
|
| |
| 5.5 |
|
|
|
|
|
|
|
|
|
| 5.0 |
|
|
|
|
|
|
|
|
|
| 4.5 |
|
|
|
|
|
|
|
|
|
| 4.0 |
|
|
|
|
|
|
|
|
|
| 3.5 |
|
|
|
|
|
|
|
|
|
| 3.0 |
|
|
|
|
|
|
|
|
|
| 2.5 |
|
|
|
|
|
|
|
|
|
| 2.0 |
|
|
|
|
|
|
|
|
|
| 1.5 |
|
|
|
|
|
|
|
|
|
| 1.0 |
|
|
|
|
|
|
|
|
|
| 0.5 |
|
|
|
|
|
|
|
|
|
| 0.0 |
|
|
|
|
|
|
|
|
|
| 30 | 35 | 40 | 45 | 50 | 55 | 60 | 65 | 70 | 75 |
|
|
|
|
|
|
| INPUT VOLTAGE (V) | |||
14
12
10
8 |
|
|
|
|
|
|
|
|
|
|
|
|
|
|
|
6 |
|
|
|
|
|
|
|
|
|
|
|
|
|
|
|
4 |
|
|
|
|
|
|
|
|
|
|
|
|
|
|
|
|
|
|
|
|
|
|
|
|
|
| |||||
2 |
|
|
|
| Vin=48V |
|
| Vin=36V |
| Vin=75V |
| ||||
|
|
|
|
|
|
|
|
| |||||||
0 |
|
|
|
|
|
|
|
|
|
|
|
|
|
|
|
|
|
|
|
|
|
|
|
|
|
|
|
|
|
| |
0 | 2 | 4 | 6 | 8 | 10 | 12 | 14 | 16 | 18 | ||||||
|
|
|
|
|
|
|
|
|
| LOAD CURRENT (A) | |||||
Figure 7: Typical input characteristics at room temperature | Figure 8:Output characteristics at room temperature |
4
DS_Q48SP12017_05302008