
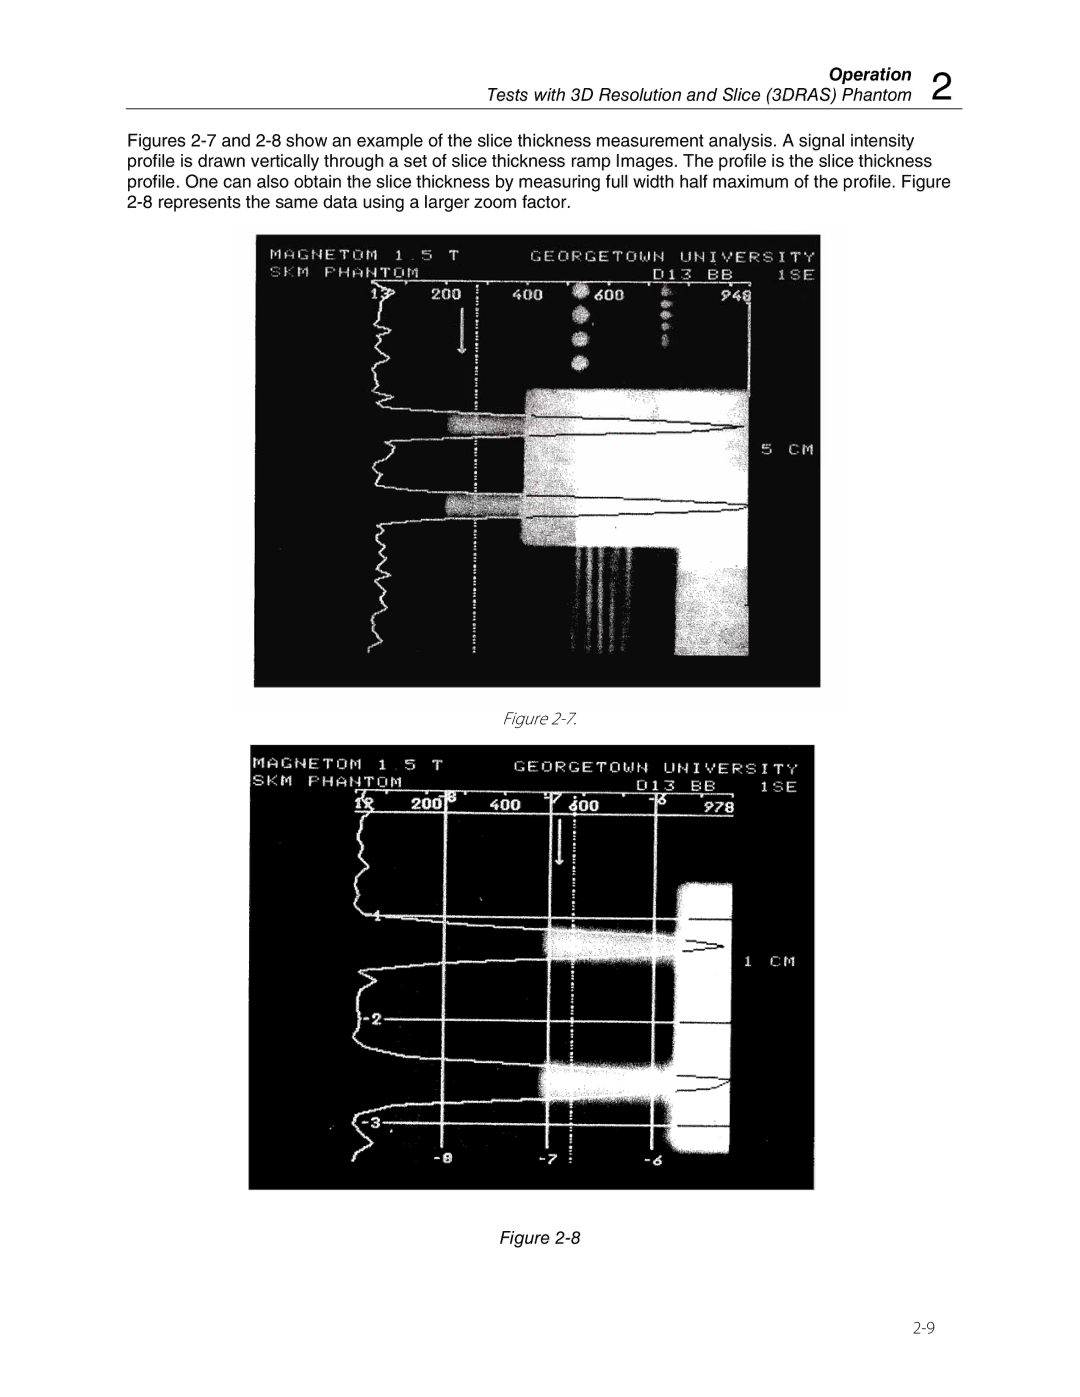
76-908, 76-907 specifications
The Fluke 76-907 and 76-908 are advanced digital multimeters designed to cater to the needs of professionals and technicians in diverse fields. Known for their accuracy, durability, and versatility, these instruments have become essential tools for electrical measurement and troubleshooting.One of the standout features of both the Fluke 76-907 and 76-908 is their superior measurement capabilities. These multimeters can measure AC and DC voltage, current, resistance, frequency, and temperature with impressive precision. The devices are equipped with a large LCD display that provides clear readings, even in low-light conditions, making it easy for users to take measurements in various environments.
The Fluke 76-907 is particularly recognized for its ergonomic design, ensuring comfort during prolonged use. It includes a built-in flashlight to illuminate dark work areas and an adjustable backlight for improved visibility of the display. Additionally, the device features a rugged casing that protects it from drops and impacts, enhancing its longevity and reliability in demanding job sites.
On the other hand, the Fluke 76-908 offers advanced features such as Bluetooth connectivity, enabling users to connect the meter to compatible smartphones and tablets. This feature allows for seamless data transfer and real-time monitoring of measurements via an intuitive app. The integration of wireless technology facilitates remote measurements, which is crucial in hazardous environments where direct access may be restricted.
Both models utilize advanced technology, including True RMS measurements, which ensure accurate readings of complex signals. This is particularly beneficial for professionals working with variable frequency drives, non-linear loads, and harmonics. The Fluke 76-907 and 76-908 also come equipped with a range of safety features, including CAT III and CAT IV ratings, ensuring they can safely handle high-voltage applications.
Battery life is another essential characteristic of these multimeters. Both models are designed for extended usage with efficient power management systems, minimizing downtime caused by battery replacements.
Furthermore, the Fluke 76-907 and 76-908 are straightforward to operate, featuring a user-friendly interface that allows technicians to navigate functions easily. They are ideal for various applications, from routine maintenance and troubleshooting in electrical systems to complex diagnostics in industrial settings.
In conclusion, the Fluke 76-907 and 76-908 digital multimeters stand out for their precise measurements, robust design, and innovative technology. Whether for fieldwork or onsite diagnostics, these multimeters provide reliability and efficiency, making them indispensable tools for professionals in the electrical industry.