User’s manual
Graphing calculator
Page
Preface
Page
Table of Contents
Calculations with real numbers
Calculations with complex numbers
Algebraic and arithmetic operations
Solution to equations
Operations with lists
Vectors
Matrices and linear algebra
Multi-variate Calculus Applications
Graphics
Calculus Applications
Vector Analysis Applications
Probability Distributions
Differential Equations
Statistical Applications
Service, W-2 Regulatory information, W-4
Limited Warranty W-1
Numbers in Different Bases
Basic Operations
Chapter Getting started
Batteries
Contents of the calculator’s display
Tool menu
Menus
Associated with the six soft menu keys, F1 through F6
Setting time and date
Introducing the calculator’s keyboard
Page
Alpha function, to enter the upper-case letter P
Selecting calculator modes
~„p
Operating Mode
23.0
√ 3.*5.-1/3.*3./23.3+EXP2.5
Lets try now the expression proposed earlier
Number Format and decimal dot or comma
Page
Page
Page
Angle Measure
Coordinate System
Selecting CAS settings
Explanation of CAS settings
Selecting Display modes
Selecting the display font
Selecting properties of the line editor
Selecting properties of the Stack
References
Selecting properties of the equation writer EQW
Editing expressions in the stack
Chapter Introducing the calculator
Calculator objects
Creating arithmetic expressions
Result³5*„Ü1+1/7will be shown„ÜR3as follows -2Q3`.5
Resulting…in³5*„Ü1+1/7the output„ÜR3-2Q3`.5
Creating algebraic expressions
+ y
Using the Equation Writer EQW to create expressions
Edited expression*„Ü5+1/3looks as follows
+ 2 ⋅ 5 +
~‚n
Subdirectories
Organizing data in the calculator
Home directory
For this example, the Home
Variables
Locks the alphabetic keyboard in lower case. When locked
Typing variable names
Name Contents Type
Creating variables
3V5K~a12`
³~„r/„Ü
Checking variables contents
‚å‚é~„r³„ì
Using the right-shift key followed by soft menu key labels
Deleting variables
Using function Purge in the stack in Algebraic mode
Using function Purge in the stack in RPN mode
@PURGE@J@@p1@@`
Choose boxes vs. Soft Menu
Undo and CMD functions
We use Show Prog menu list and select Memory ‚¯
Page
Display now shows
Not shown in this screen. To Find it we use
To activate the Order command we press the soft menu key
Chapter Calculations with real numbers
Operation key, namely Examples in ALG mode
Examples of real number calculations
For both, ALG and RPN modes, using the Equation Writer
Directly on the stack
Key. When
Combination When calculating in the stack in ALG mode
RPN mode, enter the number first, then the function, e.g
„¸Page
RPN mode
\„¸45`‚¹
Real number functions in the MTH menu
Hyperbolic functions and their inverses
Pressing shows the remaining options
Units menu
With units
Key or
Page
Labels will be listed
Available units
For Set of units
Key or Keystroke sequence to navigate Through the menus
Attaching units to numbers
With the keyboard, e.g.,will produce the entry
Using Ubase to convert to the default unit 1 m results
Operations with units
Different terms in parentheses, e.g
12m 3250mi
Unit conversions
@@OK@@-˜
Physical constants in the calculator
These operations produce the following output
Copies value with or without units to the stack
When selected, constants are shown with units attached
When selected, constants are shown without units
Exit constants library
Like this Display shows what is called a tagged value Here
Defining and using functions
Which produces
‚@@@H@@
‘LNx+1 + EXPx’
Entered by using
You could try
Chapter Calculations with complex numbers
Setting the calculator to Complex mode
To work with complex numbers select the CAS complex mode
Definitions
Polar representation of a complex number
Entering complex numbers
To enter the unit imaginary number type the I key
Simple operations with complex numbers
Cmplx menus
Cmplx menu through the MTH menu
Cmplx menu in the keyboard
Functions applied to complex numbers
Function Droite equation of a straight line
Function Droite is found in the command catalog
Reference
Chapter Algebraic and arithmetic operations
Entering algebraic objects
Simple operations with algebraic objects
Press To recover
Variable menu
@HELP@`
Functions in the ALG menu
To execute the command
Catalog To complete the operation
Trig menu, triggered by using
Expansion and factoring using log-exp functions
Expansion and factoring using trigonometric functions
Operations with transcendental functions
Shows the following menu
Functions in the Arithmetic menu
Numbers or to polynomials. The remaining options 1. Integer
Horner function
Polynomials
X6-1 = X5-5*X4+25X3-125X2+625X-3125X+5+15624
Proot function
Variable
Pcoef function
Quotient and Remainder functions
Peval function
Fractions
SIMP2 function
Partfrac function
Propfrac function
Fcoef function
Step-by-step operations with polynomials and fractions
Froots function
Reference
Symbolic solution of algebraic equations
Chapter Solution to equations
Function Isol
Function Solve
Page
Function Solvevx
Function Zeros
Numerical solver menu
Enter vector of coefficients
Polynomial Equations
Solve equation
Page
Page
Financial calculations
Solving equations with one unknown through NUM.SLV
Solution to simultaneous equations with Mslv
Solution shown is X 4.5006E-2
Page
Reference
Creating and storing lists
Chapter Operations with lists
Changing sign
Addition, subtraction, multiplication, division
Functions‚Napplied to lists
When applied to lists, acts a concatenation operator
Example
MTH/LIST menu
Lists of complex numbers
Lists of algebraic objects
Inverse 1/x
Calculate product of elements in the list
Calculate increment among consecutive elements in list
Calculate summation of elements in the list
Sorts elements in increasing order
SEQ function
SEQ function, available through the command catalog , takes
MAP function Reference
Typing vectors in the stack
Chapter Vectors
Entering vectors
General row vector Vector Vector of algebraics
Storing vectors into variables in the stack
Mode Then, ‚íin
Vectors can also be entered by using the matrix writer
Stored into variables
Key is used to edit the contents of a selected cell
WID
Function Delete Will delete
Key will add a column full of zeros at the location
Cell of the spreadsheet
Selected
Addition, subtraction
Simple operations with vectors
Used in the following exercises
Multiplication by a scalar, and division by a scalar
Absolute value function
Dot product
MTH/VECTOR menu
Magnitude
Examples
Cross product
Chapter Matrices and linear algebra
Entering matrices in the stack
Display in RPN mode will look very similar to these
Typing in the matrix directly into the stack
Operations with matrices
Addition and subtraction
Multiplication
RPN mode, try the following eight examples
Cij = aik ⋅ bkj , for i = 1,2, , m j = 1,2, , n
Page
Function DET
Solution of linear systems
Characterizing a matrix The matrix Norm menu
Function Trace
2x1 + 3x2 -5x3=
Using the numerical solver for linear systems
Press Following input form will be provide right
Can be written as the matrix equation A⋅x = b, if
@SOLVE
Solution with the inverse matrix
Solution by division of matrices
Chapter Graphics
Graphs options in the calculator
Plotting an expression of the form y = fx
Them simultaneously if in RPN mode Use a range of -4 to
As an example, lets plot the function
Here is picture
To recover the menu, and return to the Plot
Also, check that for x = -1.48 , y =
Press Then
To see the table, press Soft menu key
You will be returned to normal calculator display
Zoom factor = 0.5. Toggle
Suggested early, namely x =
Option Decimal Produces x-increments Option Integer
Fast 3D plots
Key simply changes the font in the table from small to big,
To return to normal calculator display press
Values of 10 and 8 for the Step data
Find Fast3D
You can change Orientation
@EDITL
Reference$
Press To leave the Edit environment
Limits and derivatives
Chapter Calculus Applications
Calc Calculus menu
Function lim
Including some limits
Infinity symbol is associated with Key, .e
Menu within the Calcl menu
Functions INT, INTVX, RISCH, Sigma and Sigmavx
Anti-derivatives and integrals
If and only if, fx = dF/dx, and C = constant
Xdx = F b − F a
Functions TAYLR, TAYLR0, and Series
⋅ x − x o n
Reference
Chapter Multi-variate Calculus Applications
Partial derivatives
Multiple integrals
Y dA = b Φ x , y dydx =
Del operator
Chapter Vector Analysis Applications
Gradient
Curl
Divergence
Alternatively, use function Deriv as follows
Chapter Differential Equations
Solution to linear and non-linear equations
CALC/DIFF menu
Ldec
Function Ldec
Which can be simplified to
Function Desolve
= K1⋅e-3x+ K2⋅e5x + K3⋅e2x + 450⋅x2+330⋅x+241/13500
Variable Odetype
DESOLVE`
Laplace Transforms
Laplace transform and inverses in the calculator
Fourier series for a quadratic function
Function FOURIER`
Where
Exercises. Function Collect is available in the ALG menu
Thus = 1/3, c
MTH/PROBABILITY.. sub-menu part
Chapter Probability Distributions
Factorials, combinations, and permutations
Random numbers
„´The Normal distribution
MTH/PROB menu part
Student-t distribution
Chi-square distribution
F distribution
Chapter Statistical Applications
Entering data‚Ù5
Sample vs. population
Now
Obtaining frequency distributions
Ƒ3.Fitdata
Fitting data to a function y = fx
Can be used
Lines in RPN mode
Using Key select all the options for outputs, i.e
When that field is selected Statistics
To access the summary stats… option, use
Obtaining additional summary statistics
Press to obtain the following results
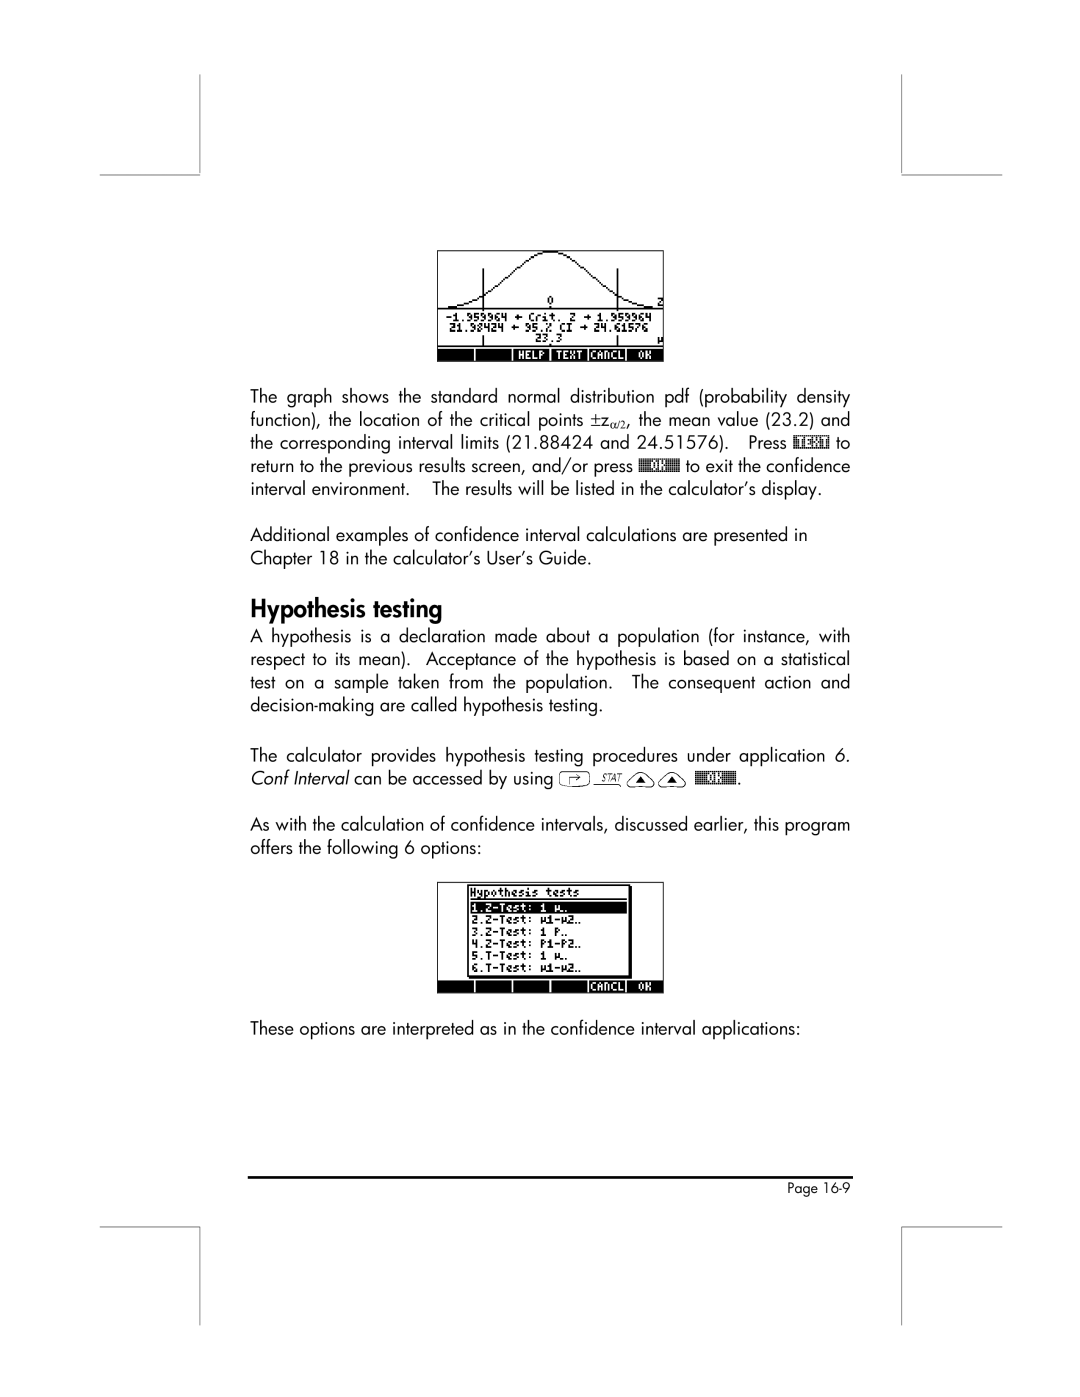
Confidence intervals
Offers the following options Interpreted as follows
@GRAPH
Interval information
Corresponding interval limits 21.88424 and 24.51576. Press
Return to the previous results screen, and/or press
@@@OK@@@
Select ∝ ≠ 150. Then, press Result is
Writing non-decimal numbers
Chapter Numbers in Different Bases
Base menu
With system flag 117 set to Soft menus, the Base menu shows
@HEX
Chapter
Using SD cards
Storing objects in the SD card
Recalling an object from the SD card
Purging an object from the SD card
Limited Warranty
Service
Canada 905 206-4663 or 800- HP
Rotc = Rest of the country
Regulatory information
USA