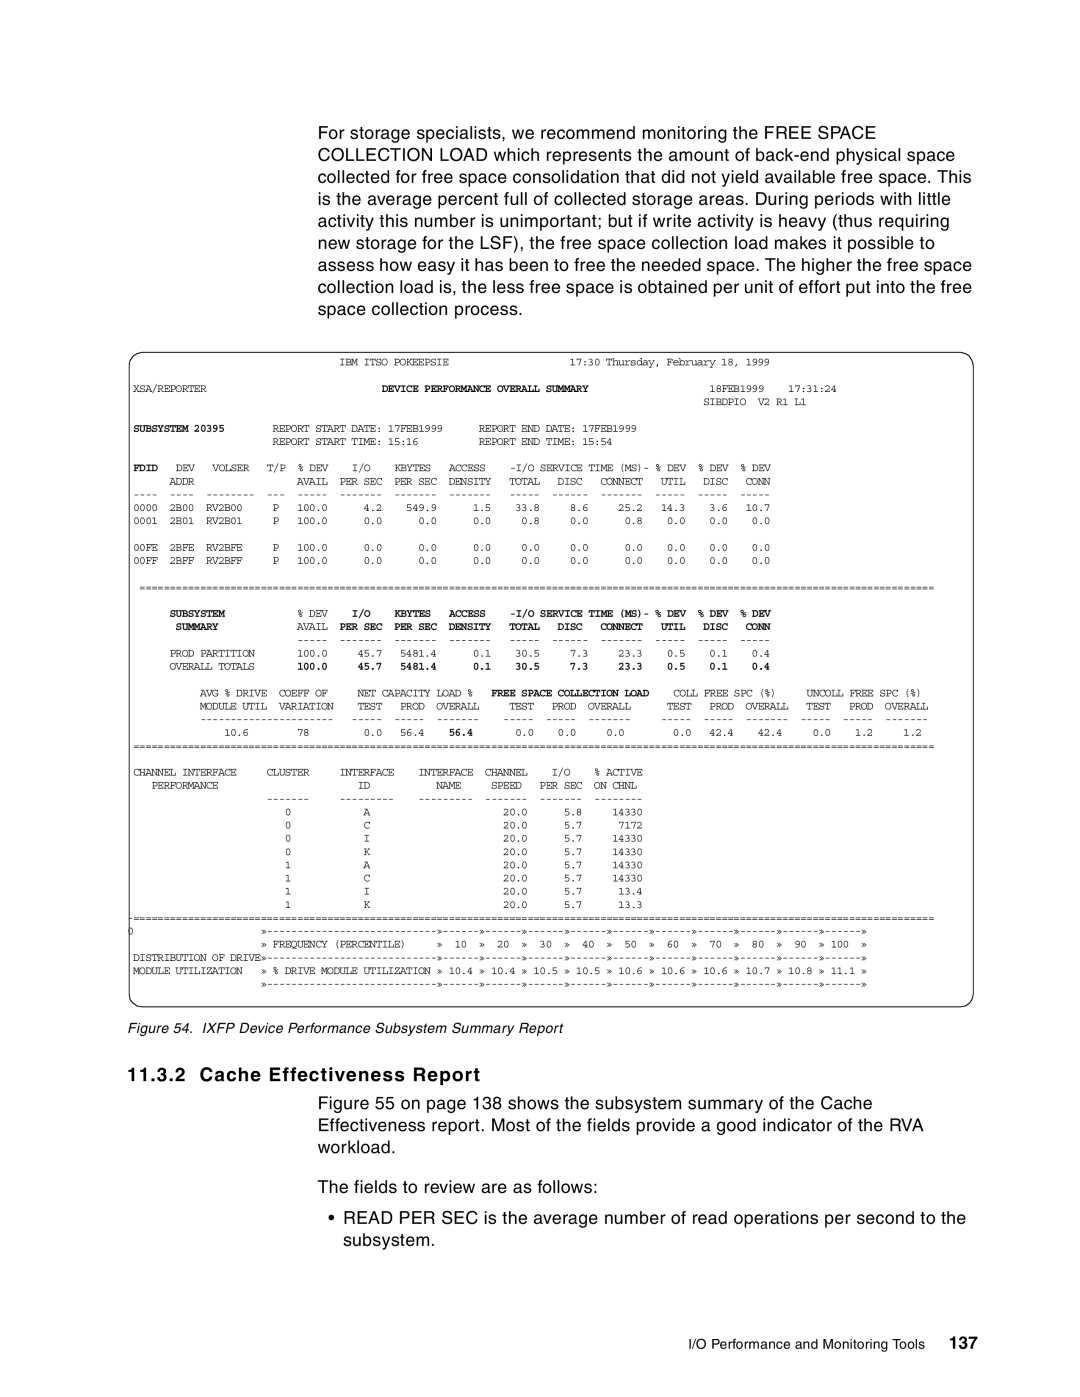
For storage specialists, we recommend monitoring the FREE SPACE COLLECTION LOAD which represents the amount of back-end physical space collected for free space consolidation that did not yield available free space. This is the average percent full of collected storage areas. During periods with little activity this number is unimportant; but if write activity is heavy (thus requiring new storage for the LSF), the free space collection load makes it possible to assess how easy it has been to free the needed space. The higher the free space collection load is, the less free space is obtained per unit of effort put into the free space collection process.


IBM ITSO POKEEPSIE


17:30 Thursday, February 18, 1999


XSA/REPORTER


DEVICE PERFORMANCE OVERALL SUMMARY


18FEB1999

17:31:24


SIBDPIO V2 R1 L1

SUBSYSTEM 20395

REPORT START DATE: 17FEB1999

REPORT END DATE: 17FEB1999


REPORT START TIME: 15:16

REPORT END TIME: 15:54


FDID

DEV

VOLSER

T/P

% DEV

I/O

KBYTES

ACCESS

-I/O SERVICE TIME (MS)- % DEV

% DEV

% DEV


ADDR


AVAIL

PER SEC

PER SEC

DENSITY

TOTAL

DISC

CONNECT

UTIL

DISC

CONN


----

----

--------

---

-----

-------

-------

-------

-----

------

-------

-----

-----

-----


0000

2B00

RV2B00

P

100.0

4.2

549.9

1.5

33.8

8.6

25.2

14.3

3.6

10.7


0001

2B01

RV2B01

P

100.0

0.0

0.0

0.0

0.8

0.0

0.8

0.0

0.0

0.0


00FE

2BFE

RV2BFE

P

100.0

0.0

0.0

0.0

0.0

0.0

0.0

0.0

0.0

0.0


00FF

2BFF

RV2BFF

P

100.0

0.0

0.0

0.0

0.0

0.0

0.0

0.0

0.0

0.0


===================================================================================================================================

SUBSYSTEM

% DEV

I/O

KBYTES

ACCESS

-I/O SERVICE TIME (MS)- % DEV

% DEV

% DEV

SUMMARY

AVAIL

PER SEC

PER SEC

DENSITY

TOTAL

DISC

CONNECT

UTIL

DISC

CONN


-----

-------

-------

-------

-----

------

-------

-----

-----

-----

PROD PARTITION

100.0

45.7

5481.4

0.1

30.5

7.3

23.3

0.5

0.1

0.4

OVERALL TOTALS

100.0

45.7

5481.4

0.1

30.5

7.3

23.3

0.5

0.1

0.4

AVG % DRIVE

COEFF OF

NET CAPACITY

LOAD %

FREE SPACE COLLECTION LOAD

COLL FREE SPC (%)

UNCOLL FREE SPC (%)

MODULE UTIL

VARIATION

TEST

PROD

OVERALL

TEST

PROD

OVERALL

TEST

PROD

OVERALL

TEST

PROD

OVERALL

----------------------

-----

-----

-------

-----

-----

-------

-----

-----

-------

-----

-----

-------

10.6

78

0.0

56.4

56.4

0.0

0.0

0.0

0.0

42.4

42.4

0.0

1.2

1.2

====================================================================================================================================

CHANNEL INTERFACE

CLUSTER

INTERFACE

INTERFACE

CHANNEL

I/O

% ACTIVE

PERFORMANCE


ID

NAME

SPEED

PER SEC

ON CHNL


-------

---------

---------

-------

-------

--------


0

A


20.0

5.8

14330


0

C


20.0

5.7

7172


0

I


20.0

5.7

14330


0

K


20.0

5.7

14330


1

A


20.0

5.7

14330


1

C


20.0

5.7

14330


1

I


20.0

5.7

13.4


1

K


20.0

5.7

13.3

====================================================================================================================================

»----------------------------

»------

»------

»------

»------

»------

»------

»------

»------

»------

»------

»

» FREQUENCY (PERCENTILE)

» 10

» 20

» 30

» 40

» 50

» 60

» 70

» 80

» 90

» 100

»

DISTRIBUTION OF DRIVE»----------------------------

»------

»------

»------

»------

»------

»------

»------

»------

»------

»------

»

MODULE UTILIZATION » % DRIVE MODULE UTILIZATION

» 10.4

» 10.4

» 10.5

» 10.5

» 10.6

» 10.6

» 10.6

» 10.7

» 10.8

» 11.1 »

»----------------------------

»------

»------

»------

»------

»------

»------

»------

»------

»------

»------

»

Figure 54. IXFP Device Performance Subsystem Summary Report

11.3.2 Cache Effectiveness Report

Figure 55 on page 138 shows the subsystem summary of the Cache Effectiveness report. Most of the fields provide a good indicator of the RVA workload.

The fields to review are as follows:

READ PER SEC is the average number of read operations per second to the subsystem.

I/O Performance and Monitoring Tools

137

Page 159
Image 159
IBM 5695-DF1, 5655-DB2 manual Cache Effectiveness Report, 137

5695-DF1, 5655-DB2 specifications

IBM 5655-DB2 and 5695-DF1 are significant components within the IBM software ecosystem, predominantly focusing on data management and integration solutions. These offerings cater primarily to enterprise environments that require robust database management systems and associated frameworks to maintain and manipulate data efficiently.

IBM 5655-DB2 is a well-known relational database management system (RDBMS) that excels in managing large volumes of structured data. Its architecture is designed to support high availability, scalability, and performance, crucial for businesses operating in today’s data-driven world. Some of its main features include advanced indexing capabilities, support for complex queries, and dynamic workload management. Additionally, it provides strong concurrency controls, which enable multiple users to access and manipulate data simultaneously without compromising data integrity.

One of the key characteristics of DB2 is its support for various data types, including JSON and XML, making it versatile for modern applications that generate data in diverse formats. It also features robust security mechanisms to protect sensitive data, aligning with compliance standards across industries. Integration with analytics tools further allows businesses to derive insights from their data, enhancing decision-making processes.

On the other hand, IBM 5695-DF1, also known as the InfoSphere DataStage, is a powerful data integration tool that facilitates the extraction, transformation, and loading (ETL) of data from various sources to target systems. It empowers organizations to streamline their data flows, ensuring that clean, consistent information is available for analysis and operational use. Key features of 5695-DF1 include a user-friendly graphical interface that enhances developer productivity and a rich set of connectors for numerous data sources, enabling seamless data integration.

DataStage also supports real-time data integration, allowing businesses to keep their data synchronized across multiple platforms. Its parallel processing capabilities dedicatedly optimize performance, enabling organizations to handle vast datasets efficiently. It incorporates data quality tools that help in validating and cleansing data before it is used for decision-making processes.

Both IBM 5655-DB2 and 5695-DF1 are part of a broader strategy to accommodate the evolving landscape of data management. Businesses leverage these technologies to enhance their data architectures, fostering agility and competitive advantage in their respective markets. Their integration capabilities, along with a focus on security and scalability, position them as vital assets in modern enterprise environments. Whether managing critical data within a database or ensuring seamless data flow across systems, these IBM offerings provide a comprehensive approach to handling complex data challenges.