USING THE TRACKER UNIT
WHAT YOU SEE ON-SCREEN
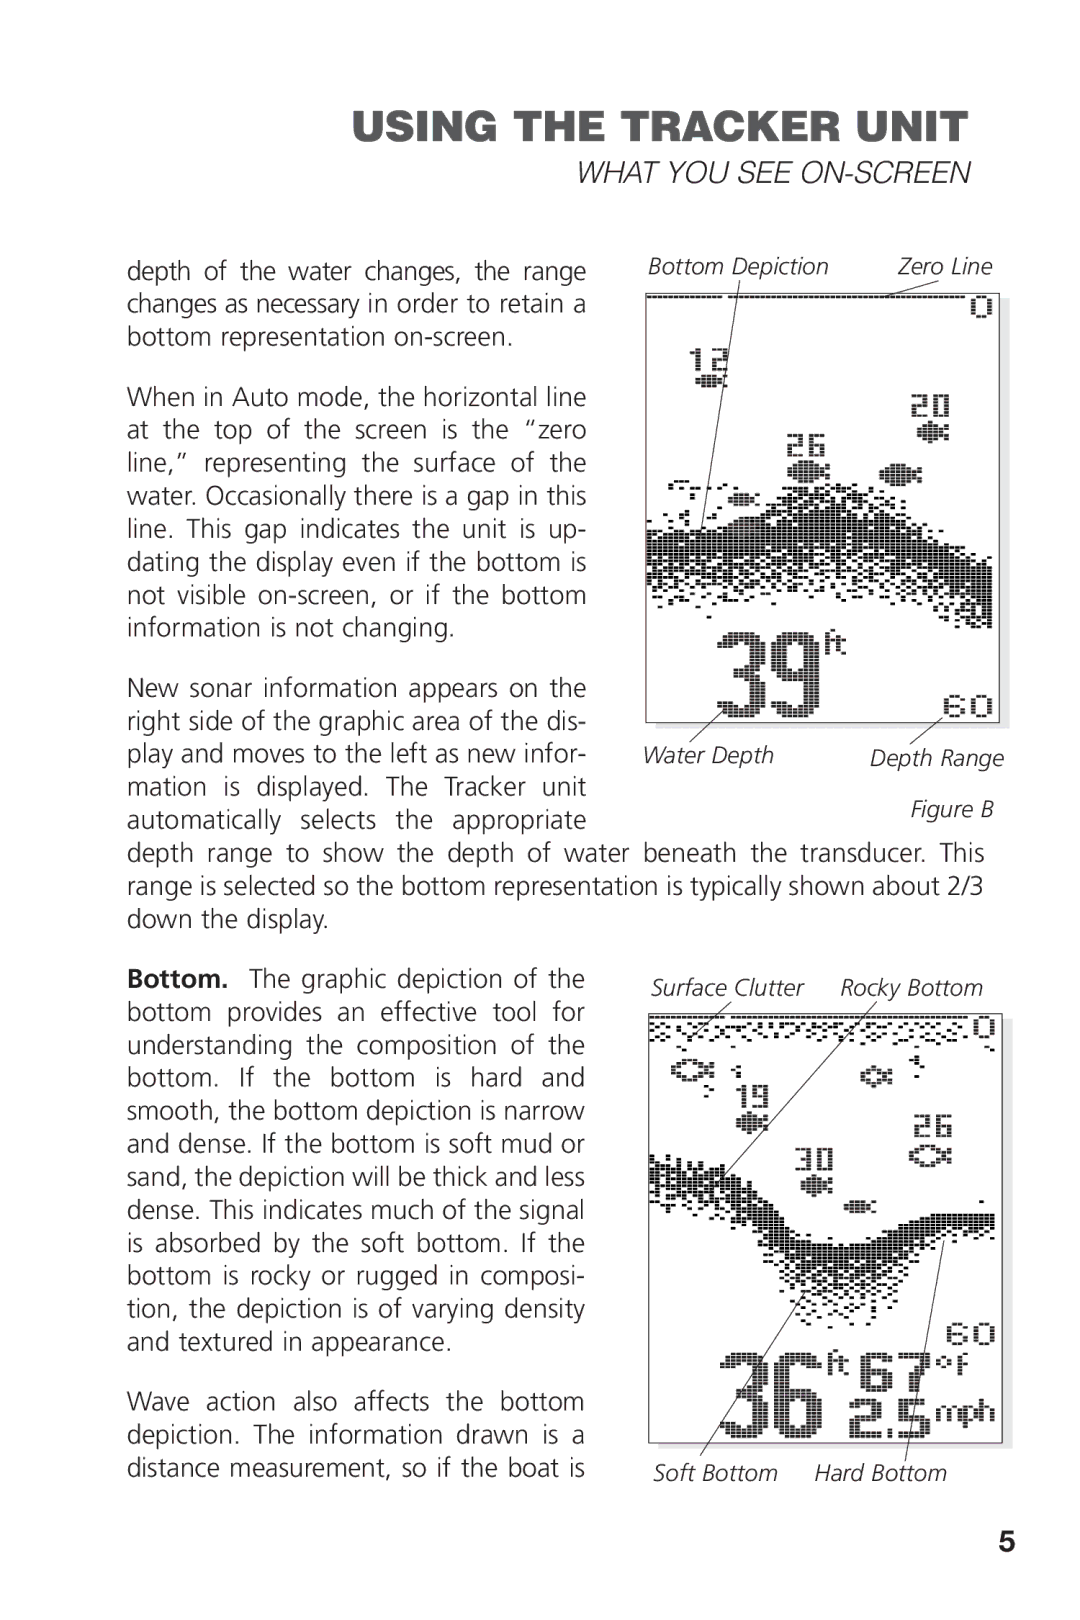
depth of the water changes, the range Bottom Depiction Zero Line changes as necessary in order to retain a ![]()
![]()
![]()
![]() bottom representation
bottom representation ![]()
When in Auto mode, the horizontal line at the top of the screen is the “zero line,” representing the surface of the water. Occasionally there is a gap in this line. This gap indicates the unit is up- dating the display even if the bottom is not visible
New sonar information appears on the right side of the graphic area of the dis- play and moves to the left as new infor-
mation is displayed. The Tracker unit automatically selects the appropriate
depth range to show the depth of water beneath the transducer. This range is selected so the bottom representation is typically shown about 2/3 down the display.
Bottom. The graphic depiction of the bottom provides an effective tool for understanding the composition of the bottom. If the bottom is hard and smooth, the bottom depiction is narrow and dense. If the bottom is soft mud or sand, the depiction will be thick and less dense. This indicates much of the signal is absorbed by the soft bottom. If the bottom is rocky or rugged in composi- tion, the depiction is of varying density and textured in appearance.
Wave action also affects the bottom depiction. The information drawn is a distance measurement, so if the boat is
Surface Clutter Rocky Bottom
Soft Bottom Hard Bottom
5