Figure 7. Measurements are made at 10° intervals along the horizontal and vertical axes.
THE DIRECTIVITY INDEX (DI): HOW WE MEASURE THE RELATIONSHIP BETWEEN
The Directivity Index (DI) is the ratio of the intensity of the sound in the listening window to the average of the intensity of the sound radiated at all angles (sound power). We make measurements of the speakers in two semicircular patterns along the horizontal and vertical axes of the speaker (Figure 7). With those measurements, we determine the size of the optimal listening window and calculate the sound power of the speaker. We then compare the sound power to the response in the listening window and plot the directivity index for the speaker system’s frequency response.
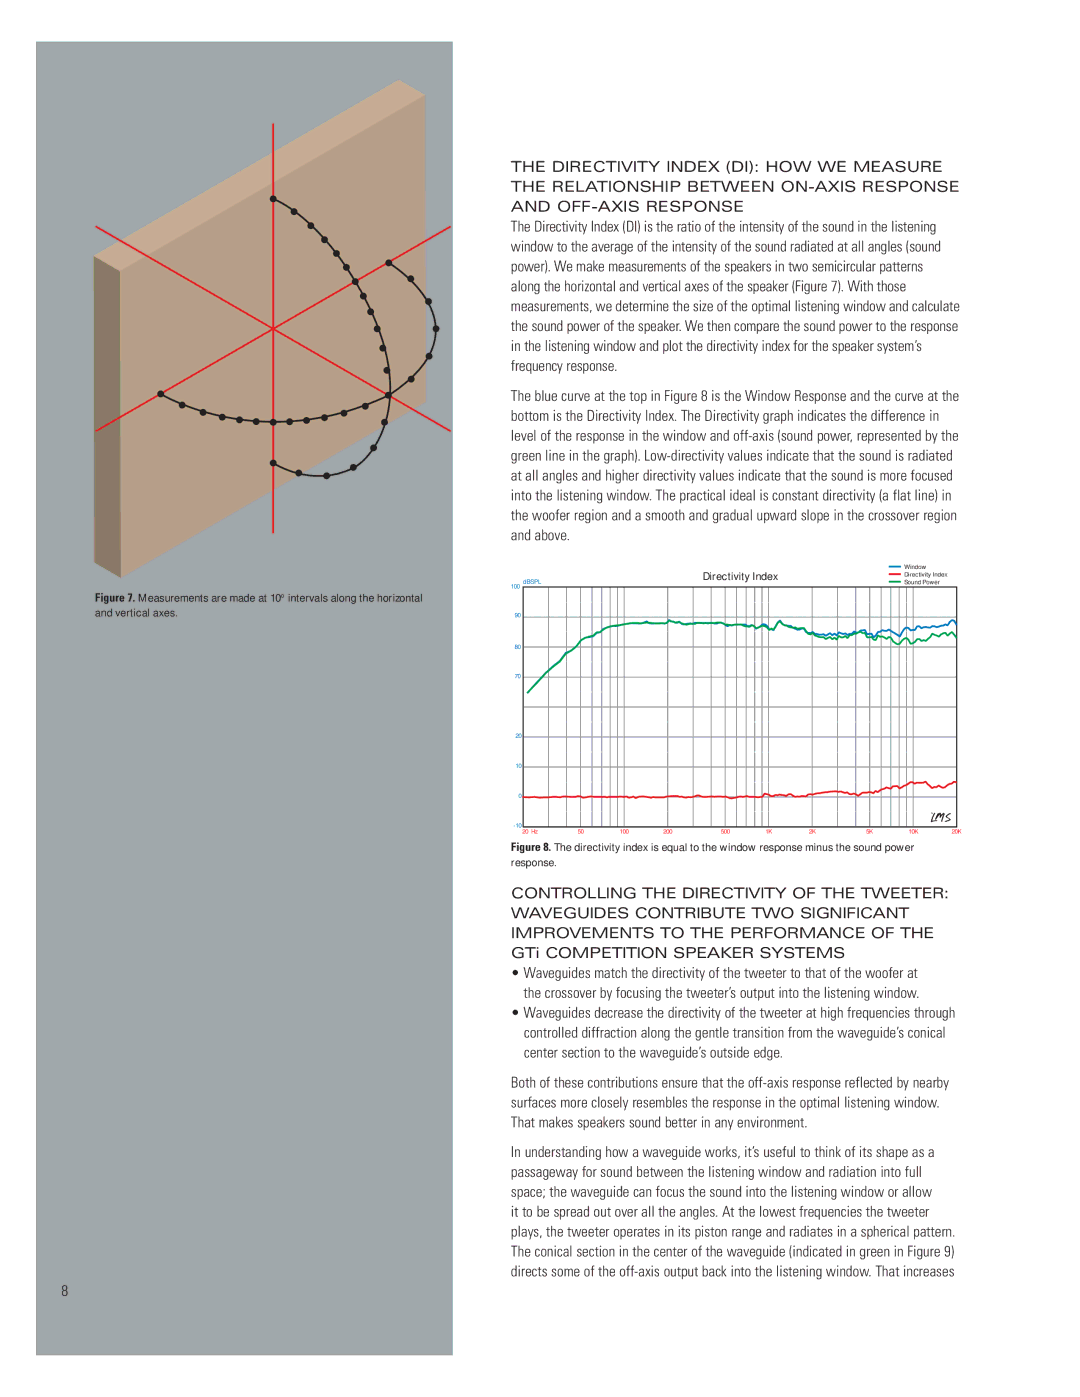
The blue curve at the top in Figure 8 is the Window Response and the curve at the bottom is the Directivity Index. The Directivity graph indicates the difference in level of the response in the window and
|
|
|
| Directivity Index |
|
| Window |
| |
dBSPL |
|
|
|
|
| Directivity Index |
| ||
|
|
|
|
| Sound Power |
| |||
|
|
|
|
|
|
|
| ||
100 |
|
|
|
|
|
|
|
|
|
90 |
|
|
|
|
|
|
|
|
|
80 |
|
|
|
|
|
|
|
|
|
70 |
|
|
|
|
|
|
|
|
|
20 |
|
|
|
|
|
|
|
|
|
10 |
|
|
|
|
|
|
|
|
|
0 |
|
|
|
|
|
|
|
|
|
50 | 100 | 200 | 500 | 1K | 2K | 5K | 10K | 20K | |
20 Hz | |||||||||
Figure 8. The directivity index is equal to the window response minus the sound power response.
CONTROLLING THE DIRECTIVITY OF THE TWEETER: WAVEGUIDES CONTRIBUTE TWO SIGNIFICANT IMPROVEMENTS TO THE PERFORMANCE OF THE GTi COMPETITION SPEAKER SYSTEMS
•Waveguides match the directivity of the tweeter to that of the woofer at the crossover by focusing the tweeter’s output into the listening window.
•Waveguides decrease the directivity of the tweeter at high frequencies through controlled diffraction along the gentle transition from the waveguide’s conical center section to the waveguide’s outside edge.
Both of these contributions ensure that the
In understanding how a waveguide works, it’s useful to think of its shape as a passageway for sound between the listening window and radiation into full space; the waveguide can focus the sound into the listening window or allow it to be spread out over all the angles. At the lowest frequencies the tweeter plays, the tweeter operates in its piston range and radiates in a spherical pattern. The conical section in the center of the waveguide (indicated in green in Figure 9) directs some of the
8