The icons displayed forecasts the w eather in terms of getting better or worse and not necessarily sunny or rainy as each icon indicates. For example, if the current weather is cloudy and the rainy icon is displayed, it does not mean that the product is faulty because it is not raining. It simply means that the air pressure has dropped and the weather is expected to get worse but not necessarily rainy.
NOTE:
After set up, readings for weather forecasts should be disregarded for the next
Common to weather forecasting, absolute accuracy cannot be guaranteed. The weather forecasting feature is estimated to have an accuracy level of about 75% due to the varying areas the Weather station has been designed for use. In areas that experience sudden changes in weather (for example from sunny to rain), the Weather station will be more accurate compared to use in areas where the weather is stagnant most of the ti me (for example mostly sunny).
If the Weather station is moved to another location significantly higher or lower than its initial standing point (for example from the ground floor to the upper floors of a house), discard the weather forecast for the next
WEATHER TENDENCY INDICATOR
Working together with the weather icons is the weather tendency indicators (located on the left and right sides of the weather icons). When the indicator points upwards, it means that the
Taking this into account, one can see how the w eather has changed and is expected to change. For example, if the indicator is pointing downwards together with cloud and sun icons, then the last noticeable change in the weather was when it was sunny (the sun icon only). Therefore, the next change in the weather will be cloud with rain icons since the indicator is pointing downwards.
NOTE:
Once the weather tendency indicator has registered a change in air pressure, it will rem ain permanently visualized on the LCD.
AIR PRESSURE HISTORY (ELECTRONIC BAROMETER W ITH BAROM ETRIC PRESSURE TREND) The bottom section of the LCD also shows the relative air pressure value and the air pressure history.
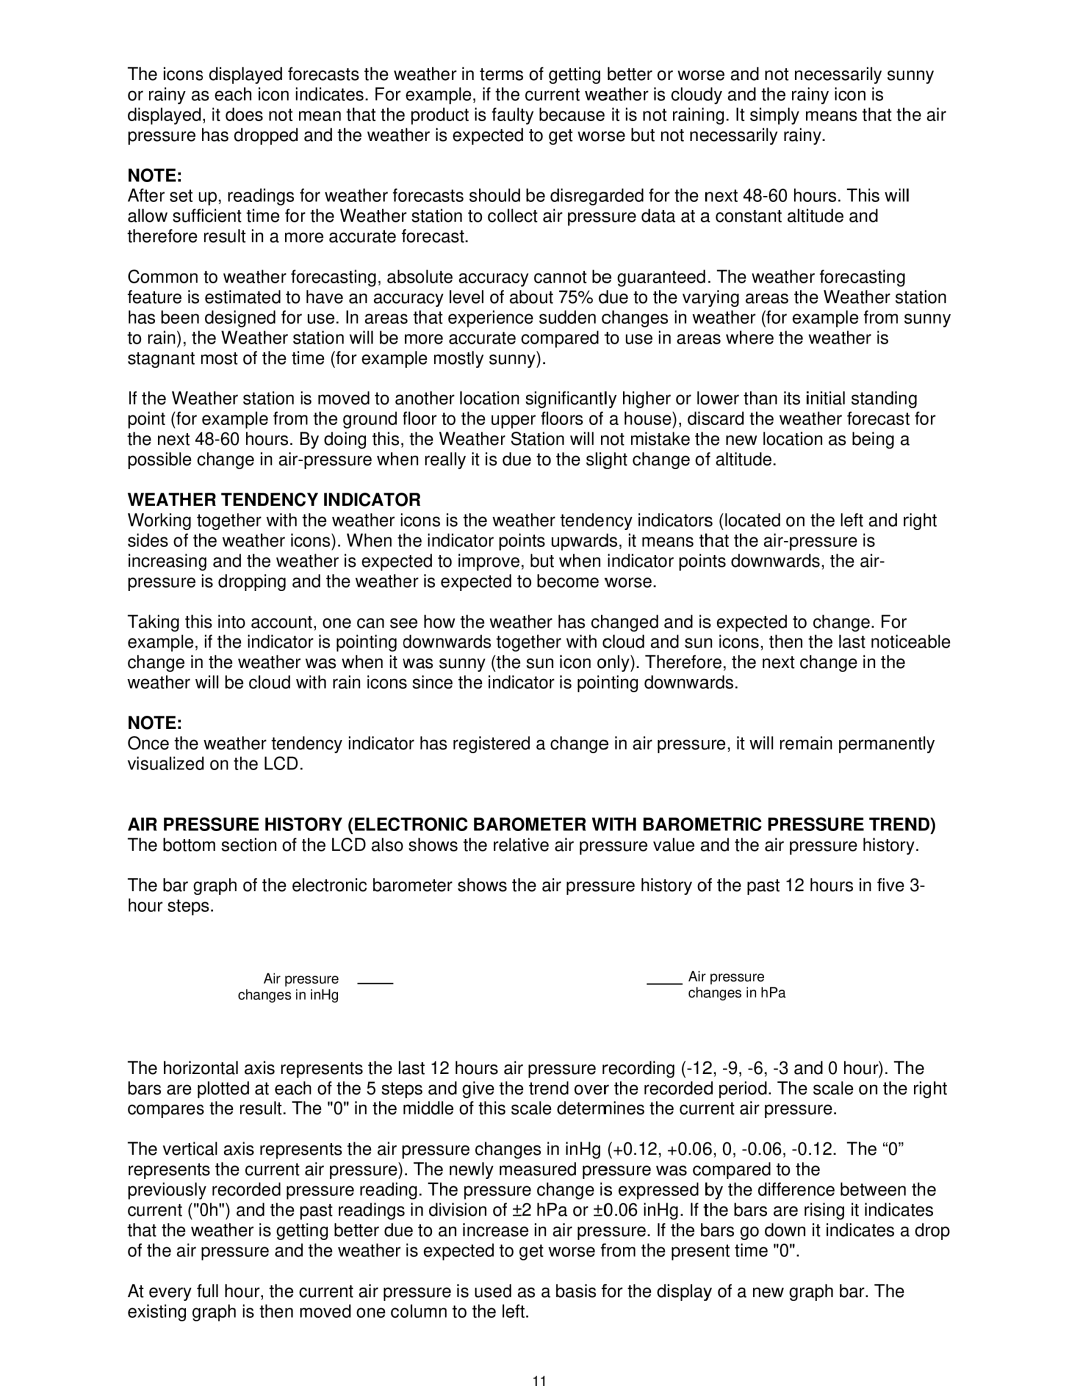
The bar graph of the electronic barometer shows the air pressure history of the past 12 hours in five 3- hour steps.
Air pressure |
|
|
| Air pressure |
changes in inHg |
|
|
| changes in hPa |
The horizontal axis represents the l ast 12 hours air pressure recording
The vertical axis represents the air pressure changes in inHg (+0.12, +0.06, 0,
previously recorded pressure reading. The pressure change is expressed by the difference between the current ("0h") and the past readings in division of ±2 hPa or ±0.06 inHg. If the bars are rising it indicates that the weather is getting better due to an increase in air pressure. If the bars go down it indicates a drop of the air pressure and the weather is expected to get worse from the present time "0".
At every full hour, the current air pressure is use d as a basis for the display of a new graph bar. The existing graph is then moved one column to the left.
11