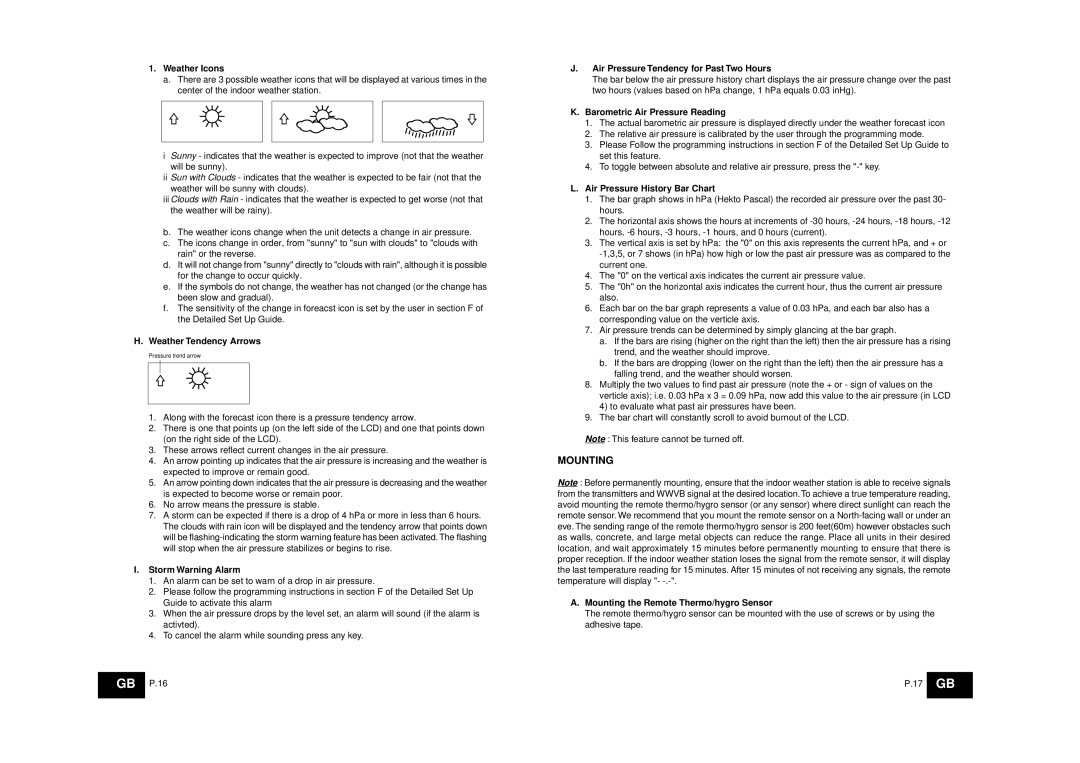
1.Weather Icons
a.There are 3 possible weather icons that will be displayed at various times in the center of the indoor weather station.
iSunny - indicates that the weather is expected to improve (not that the weather will be sunny).
iiSun with Clouds - indicates that the weather is expected to be fair (not that the weather will be sunny with clouds).
iiiClouds with Rain - indicates that the weather is expected to get worse (not that the weather will be rainy).
b.The weather icons change when the unit detects a change in air pressure.
c.The icons change in order, from "sunny" to "sun with clouds" to "clouds with rain" or the reverse.
d.It will not change from "sunny" directly to "clouds with rain", although it is possible for the change to occur quickly.
e.If the symbols do not change, the weather has not changed (or the change has been slow and gradual).
f.The sensitivity of the change in foreacst icon is set by the user in section F of the Detailed Set Up Guide.
H. Weather Tendency Arrows
Pressure trend arrow
1.Along with the forecast icon there is a pressure tendency arrow.
2.There is one that points up (on the left side of the LCD) and one that points down (on the right side of the LCD).
3.These arrows reflect current changes in the air pressure.
4.An arrow pointing up indicates that the air pressure is increasing and the weather is expected to improve or remain good.
5.An arrow pointing down indicates that the air pressure is decreasing and the weather is expected to become worse or remain poor.
6.No arrow means the pressure is stable.
7.A storm can be expected if there is a drop of 4 hPa or more in less than 6 hours. The clouds with rain icon will be displayed and the tendency arrow that points down will be
I. Storm Warning Alarm
1.An alarm can be set to warn of a drop in air pressure.
2.Please follow the programming instructions in section F of the Detailed Set Up Guide to activate this alarm
3.When the air pressure drops by the level set, an alarm will sound (if the alarm is activted).
4.To cancel the alarm while sounding press any key.
J.Air Pressure Tendency for Past Two Hours
The bar below the air pressure history chart displays the air pressure change over the past two hours (values based on hPa change, 1 hPa equals 0.03 inHg).
K.Barometric Air Pressure Reading
1.The actual barometric air pressure is displayed directly under the weather forecast icon
2.The relative air pressure is calibrated by the user through the programming mode.
3.Please Follow the programming instructions in section F of the Detailed Set Up Guide to set this feature.
4.To toggle between absolute and relative air pressure, press the
L.Air Pressure History Bar Chart
1.The bar graph shows in hPa (Hekto Pascal) the recorded air pressure over the past 30- hours.
2.The horizontal axis shows the hours at increments of
3.The vertical axis is set by hPa: the "0" on this axis represents the current hPa, and + or
4.The "0" on the vertical axis indicates the current air pressure value.
5.The "0h" on the horizontal axis indicates the current hour, thus the current air pressure also.
6.Each bar on the bar graph represents a value of 0.03 hPa, and each bar also has a corresponding value on the verticle axis.
7.Air pressure trends can be determined by simply glancing at the bar graph.
a.If the bars are rising (higher on the right than the left) then the air pressure has a rising trend, and the weather should improve.
b.If the bars are dropping (lower on the right than the left) then the air pressure has a falling trend, and the weather should worsen.
8.Multiply the two values to find past air pressure (note the + or - sign of values on the verticle axis); i.e. 0.03 hPa x 3 = 0.09 hPa, now add this value to the air pressure (in LCD 4) to evaluate what past air pressures have been.
9.The bar chart will constantly scroll to avoid burnout of the LCD.
Note : This feature cannot be turned off.
MOUNTING
Note : Before permanently mounting, ensure that the indoor weather station is able to receive signals from the transmitters and WWVB signal at the desired location. To achieve a true temperature reading, avoid mounting the remote thermo/hygro sensor (or any sensor) where direct sunlight can reach the remote sensor. We recommend that you mount the remote sensor on a
A.Mounting the Remote Thermo/hygro Sensor
The remote thermo/hygro sensor can be mounted with the use of screws or by using the adhesive tape.
GB | P.16 | P.17 | GB |
|
|
|
|