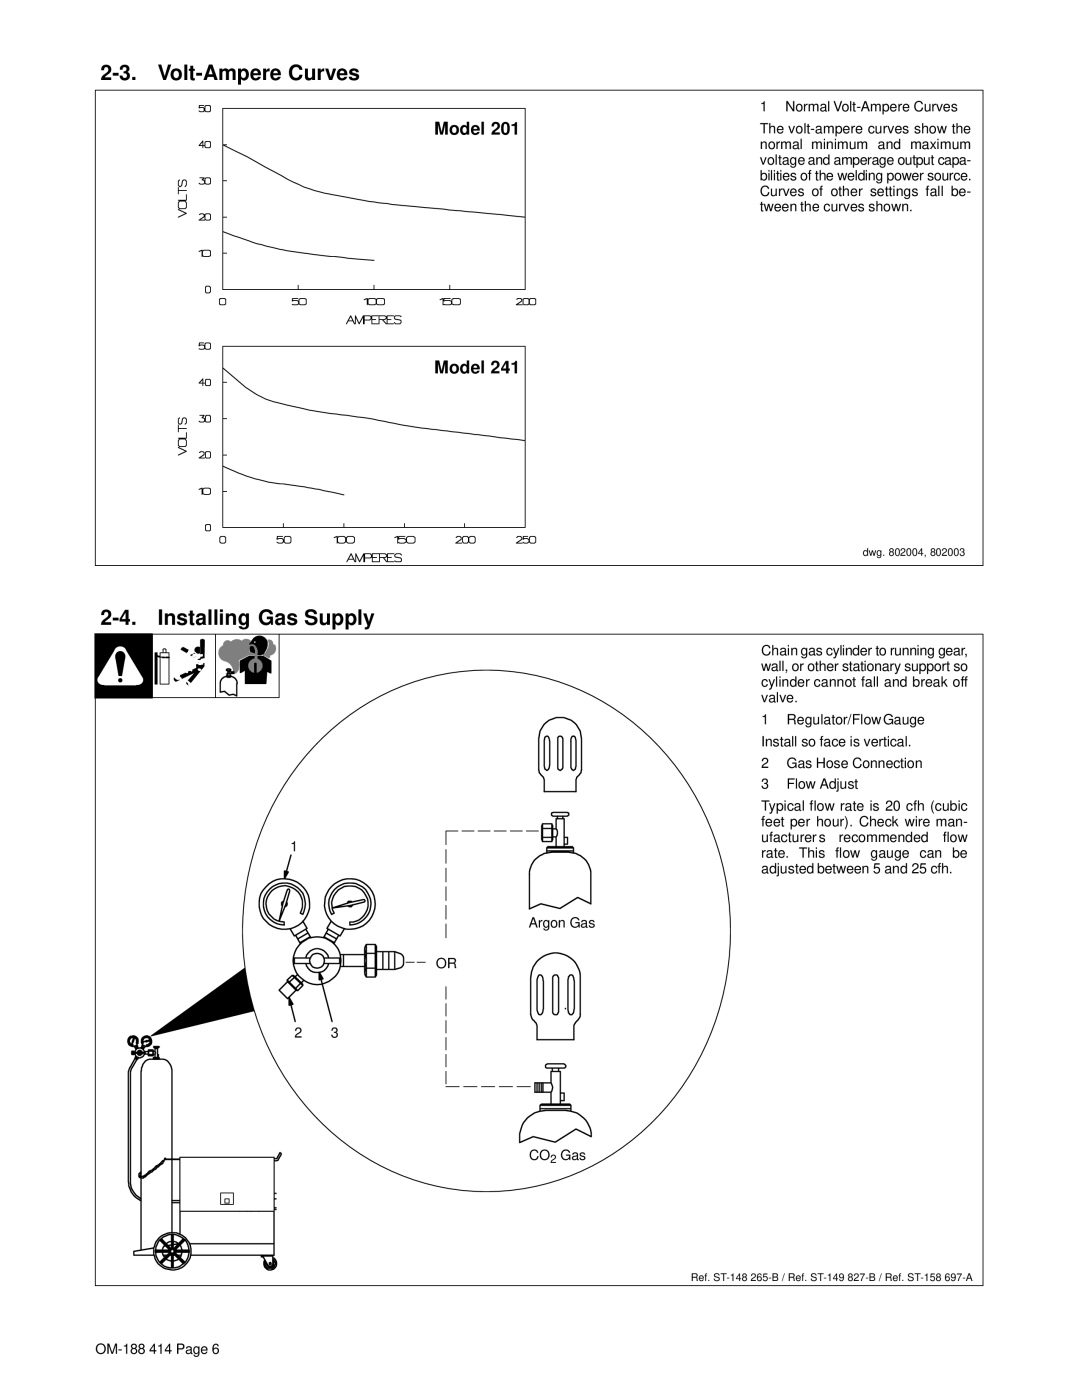
2-3. Volt-Ampere Curves
| 1 Normal |
Model 201 | The |
| normal minimum and maximum |
| voltage and amperage output capa- |
| bilities of the welding power source. |
| Curves of other settings fall be- |
| tween the curves shown. |
Model 241
|
|
| dwg. 802004, 802003 | ||
|
|
|
| ||
| Chain gas cylinder to running gear, | ||||
| wall, or other stationary support so | ||||
| cylinder cannot fall and break off | ||||
| valve. |
|
| ||
| 1 | Regulator/Flow Gauge |
| ||
| Install so face is vertical. |
| |||
| 2 | Gas Hose Connection |
| ||
| 3 | Flow Adjust |
| ||
| Typical flow rate is 20 cfh (cubic | ||||
| feet per hour). Check wire man- | ||||
1 | ufacturer’s | recommended | flow | ||
rate. This flow gauge can be | |||||
| |||||
| adjusted between 5 and 25 cfh. | ||||
| Argon Gas |
|
|
| |
| OR |
|
|
| |
2 | 3 |
|
|
| |
| CO2 Gas |
|
|
| |
| Ref. | ||||
|
|
|
| ||
