StockBoss Interactive for PageWriter/Timeport User’s Guide
End of Day Rpt; At the end of the market trading day an End of Day closing summary message is sent to the destinations selected. Note, to ensure the charts are updated the end of day report should be left on.
In order to save any changes the user must proceed from the first screen to the second and then select the Save option.
10.Charts
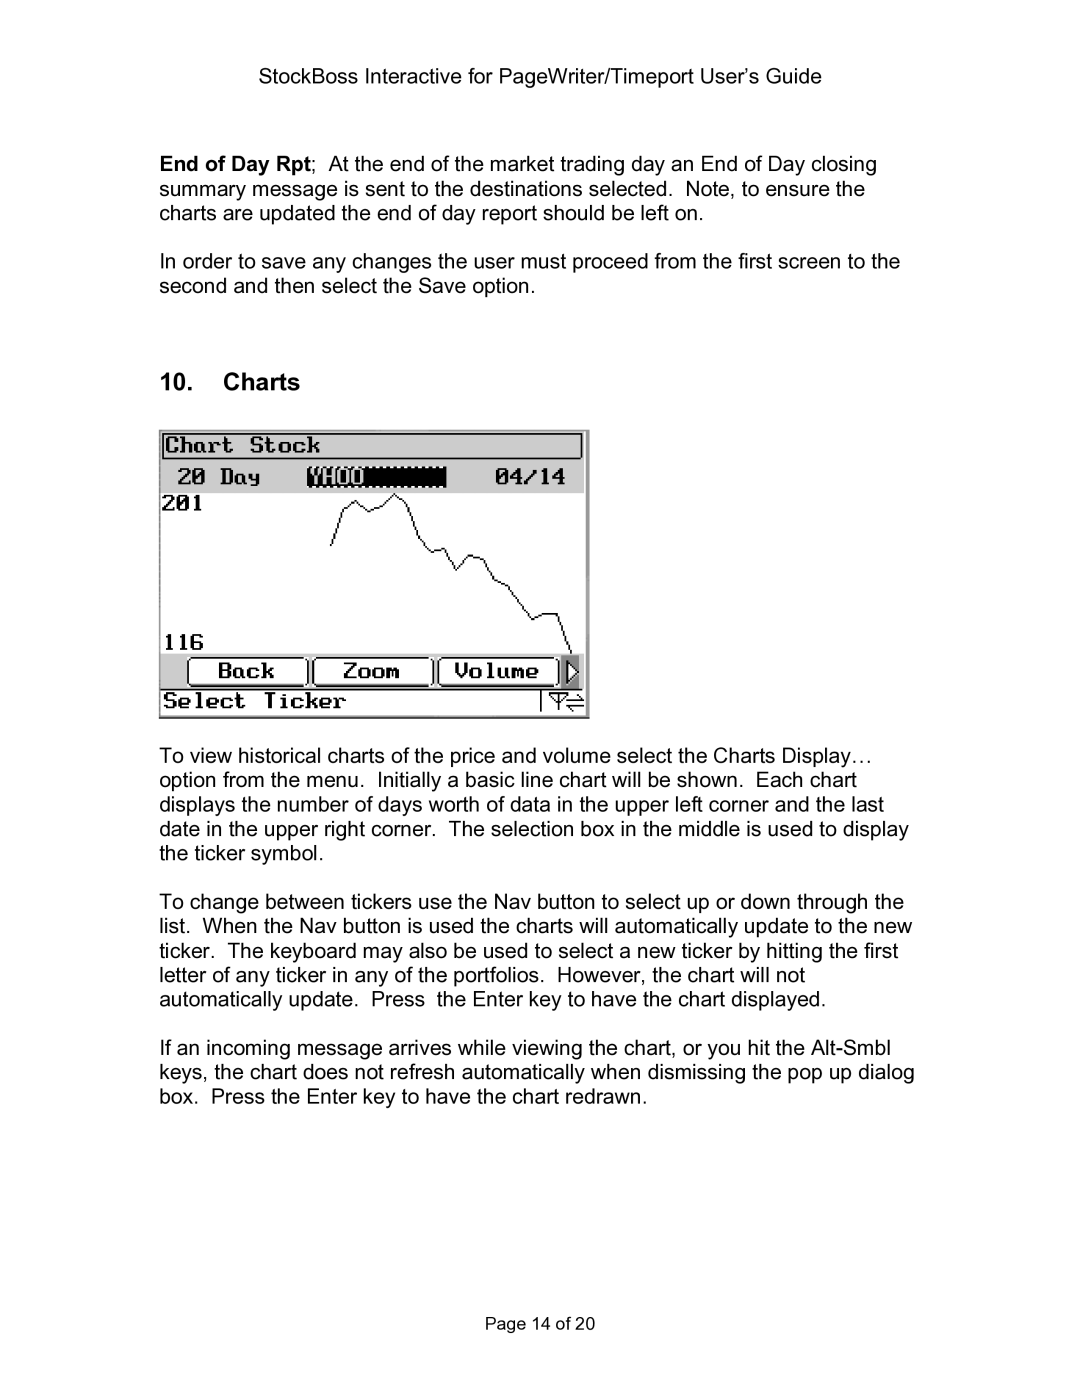
To view historical charts of the price and volume select the Charts Display… option from the menu. Initially a basic line chart will be shown. Each chart displays the number of days worth of data in the upper left corner and the last date in the upper right corner. The selection box in the middle is used to display the ticker symbol.
To change between tickers use the Nav button to select up or down through the list. When the Nav button is used the charts will automatically update to the new ticker. The keyboard may also be used to select a new ticker by hitting the first letter of any ticker in any of the portfolios. However, the chart will not automatically update. Press the Enter key to have the chart displayed.
If an incoming message arrives while viewing the chart, or you hit the
Page 14 of 20
