StockBoss Interactive for PageWriter/Timeport User’s Guide
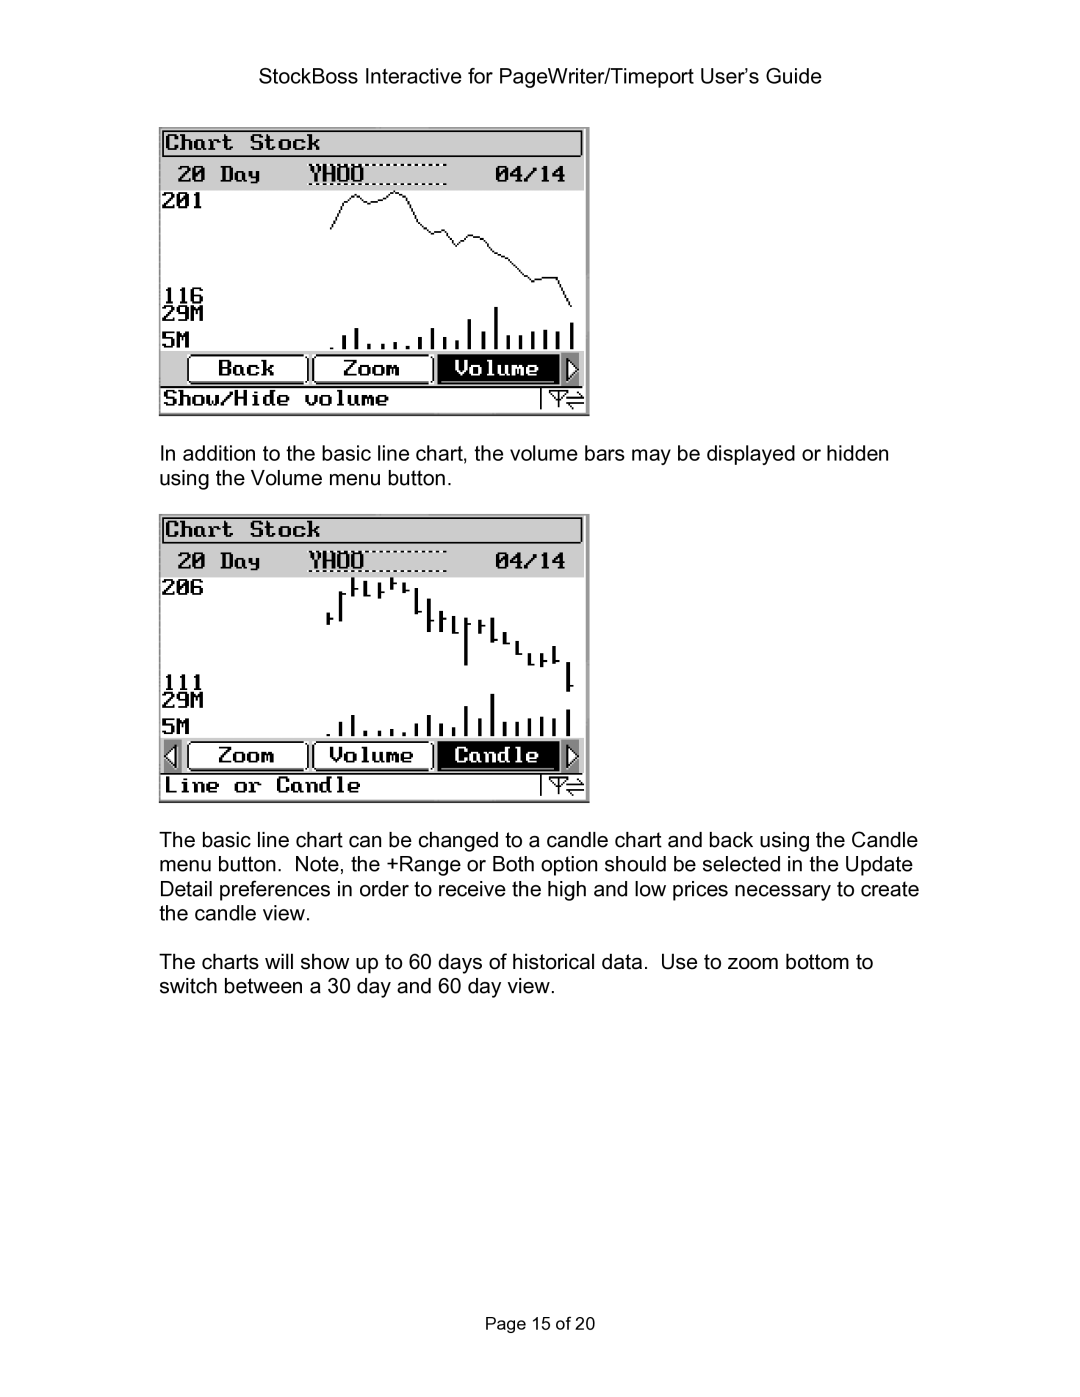
In addition to the basic line chart, the volume bars may be displayed or hidden using the Volume menu button.
The basic line chart can be changed to a candle chart and back using the Candle menu button. Note, the +Range or Both option should be selected in the Update Detail preferences in order to receive the high and low prices necessary to create the candle view.
The charts will show up to 60 days of historical data. Use to zoom bottom to switch between a 30 day and 60 day view.
Page 15 of 20